

The Open-Red network was born from an agreement between the Spanish Nuclear Safety Council (CSN) and Fundación Ibercivis, and has been developed together with the University of Zaragoza, the University of Cantabria, the Universitat Politècnica de Catalunya and CIEMAT. It has now passed 500,000 gamma radiation readings taken by citizen scientists with pocket detectors.
A first, provisional analysis shows that the data reproduce what geology would lead us to expect, with more radiation over granite and less on the limestone coast, and that every value corresponds to the natural background, with no risk to health. The network now needs more measurements, repeated over time and in areas with no data yet, and lends detectors to anyone who wants to organise their own campaigns.
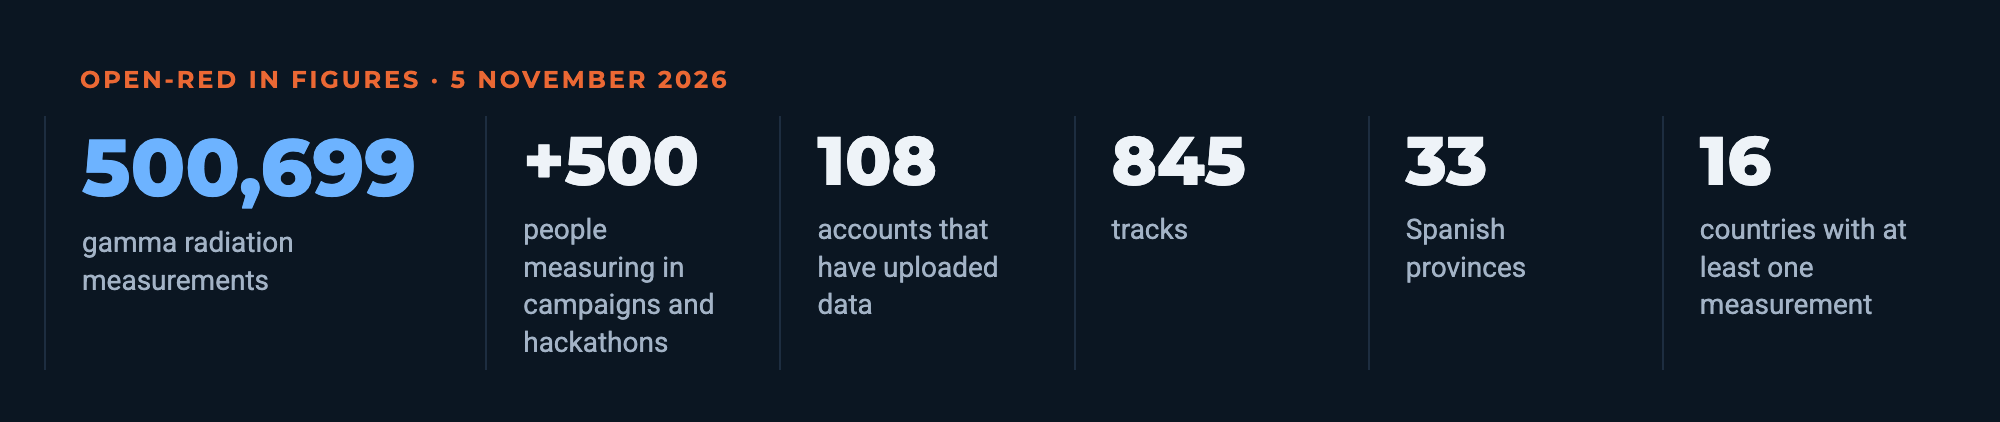
We are all exposed, at every moment, to a small amount of radiation that has nothing artificial about it. It comes from rocks and soil, which contain uranium, thorium and potassium, from building materials and from cosmic rays arriving from space. Its intensity changes from place to place, and it is not the same on a beach in Mallorca as on the granite of Salamanca. Measuring it in detail, street by street and path by path, is the goal of Open-Red, a citizen science network that has just reached 500,699 measurements.
Behind that figure are 108 user accounts that have uploaded tracks to the platform, 845 trips on foot, by bike, by car or while travelling, 71 detectors and 217 measuring days between 25 August 2025 and 5 November 2026. 85 % of the readings were taken in Spain, in 33 provinces, although there are measurements in 16 countries.
The radiation Open-Red measures
Radioactivity is the property of some unstable atoms of turning into others while releasing energy. That energy comes out as three main types of radiation. Alpha radiation is made of helium nuclei, heavy particles that are stopped by a sheet of paper or the outer layer of the skin and travel only a few centimetres in air. It is only dangerous if the atom that emits it enters the body by being breathed in or swallowed, as happens with radon, a gas that seeps out of the ground. Beta radiation is made of electrons, travels a few metres in air and is stopped by a few millimetres of aluminium or plastic. Gamma radiation, by contrast, is electromagnetic radiation, like visible light but of very high energy. It passes through the body and is gradually attenuated in air, so that its intensity halves roughly every hundred metres. Only thick layers of lead, concrete or earth stop it.
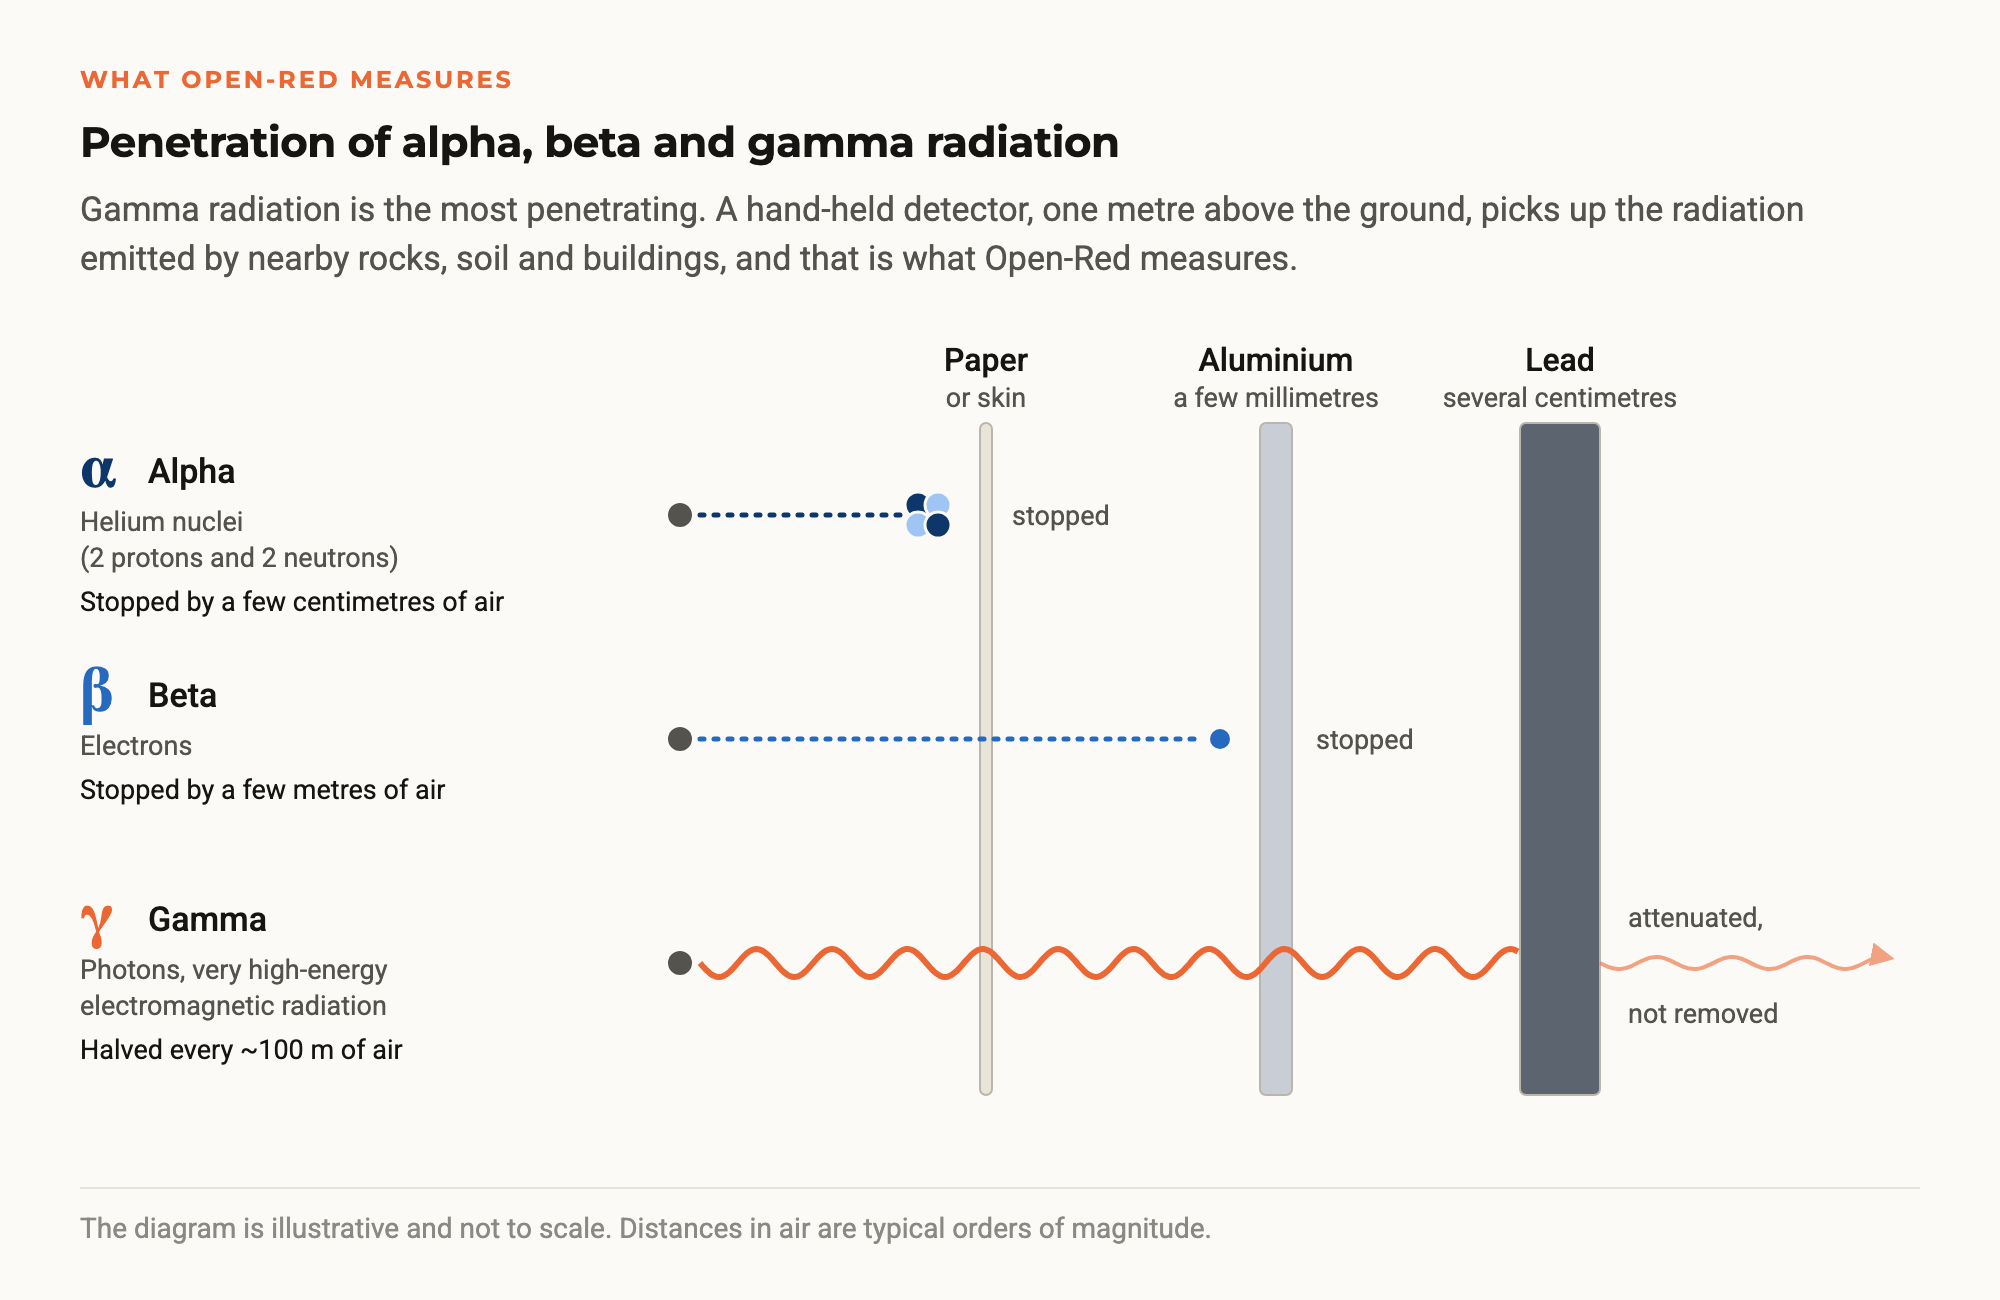
Open-Red measures gamma radiation, the radiation that reaches a hand-held detector one metre above the ground from the surrounding rocks, soil and buildings. Most of what it records comes from a few tens of metres around it and from the top few centimetres of soil. It is emitted mainly by potassium-40 and by the decay products of uranium and thorium in the Earth’s crust, including those of radon itself, and the cosmic-ray component adds to it. The project’s detectors contain a scintillator crystal that produces a flash of light every time a gamma photon hits it. By counting those flashes and measuring their energy, the device calculates the dose rate, expressed in microsieverts per hour (µSv/h). A microsievert is one millionth of a sievert, the unit used to measure the effect of radiation on the human body.
The agreement and the partners
Open-Red was born from a collaboration agreement between the Spanish Nuclear Safety Council (CSN) and Fundación Ibercivis. Over 30 months, until it ended on 21 June 2026, the project set out to create an open, collaborative network to measure and map environmental gamma radiation in Spain, with high-resolution data collected by citizens themselves.
Ibercivis coordinated the project with four partners, the University of Zaragoza, the University of Cantabria, the Universitat Politècnica de Catalunya (UPC) and CIEMAT (the Spanish Centre for Energy, Environmental and Technological Research). It also had a group of experts from those institutions and from the CSN itself, who advised on the design of the network and on data validation.
The first step was to choose the right instrument. At the laboratories of the Institute of Energy Technologies (INTE) of the UPC, several low-cost detectors were tested, from apps that use the phone’s camera to Geiger counters. Using caesium-137 sources, the team measured their linearity, their response to angle and energy, their drift with temperature and their ability to pick up the cosmic background. The conclusion was that not every cheap device will do. The one chosen was the RadiaCode 102, a pocket scintillation spectrometer, of which the project bought 65 units to lend out during the campaigns.

On that basis, Ibercivis developed the Open-Red platform, which includes a public interactive map at map.open-red.es, an open data API and a free app for iOS (App Store) and Android (Google Play). The app collects the detector’s readings and uploads them with their location. Each measurement is linked to a device, a track and a campaign, so any point on the map can be traced back to the instrument that recorded it.

Campaigns and participation
The network did not fill up on its own. The project organised three hackathons in four cities, Madrid (at CIEMAT), Zaragoza and Santander-Bilbao, with 138 participants. Between November 2025 and May 2026 it also ran 21 measurement campaigns in urban, rural and island settings, with schools in Madrid, Badajoz, Burgos and Asturias, universities in Palma, La Laguna, Santander, Bilbao, Burgos and Zaragoza, and campaigns in Melilla, at the CSIC Science House in Valencia, on the Moncayo and in the Ciudad Rodrigo area. In total, more than 500 people have measured with Open-Red in one of these activities. That is many more than the 108 accounts in the database because, in schools, several students shared a single RadiaCode and uploaded their measurements from one account.


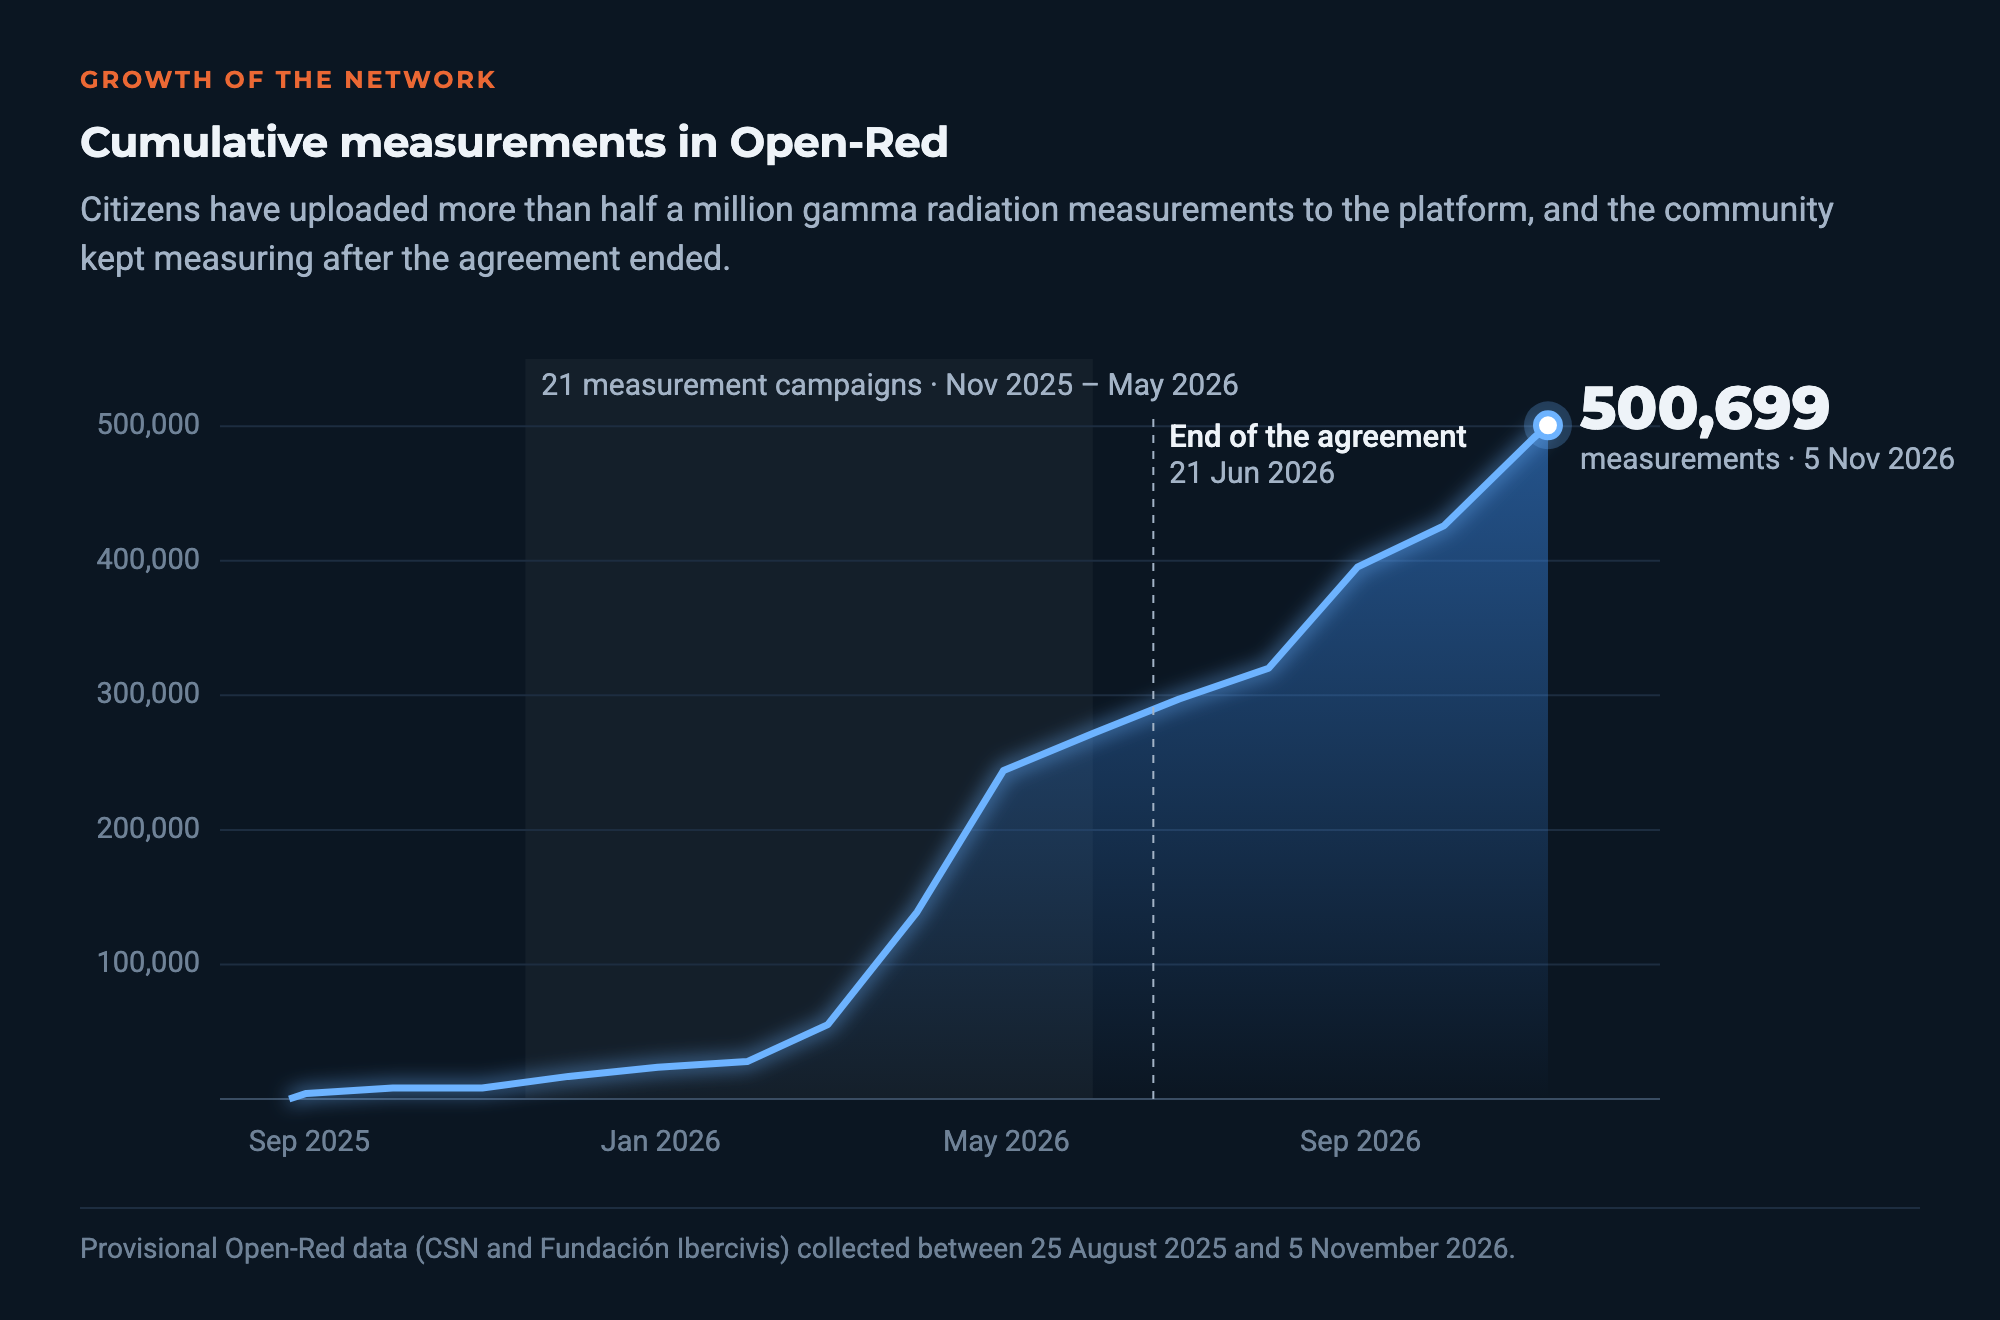
When the agreement ended in June, the network held about 280,000 measurements. It then kept growing, to 409,720 in September, and has now passed half a million, because the community has kept measuring on its own.
Who measures and when
The data show two ways of taking part. The campaigns concentrate activity in March and April 2026, when 29 and 43 different accounts measured and almost 190,000 readings were collected. A very steady core of citizen scientists then kept the network going through summer and autumn, and in August and October 2026 exceeded 65,000 measurements a month with fewer than ten active accounts.
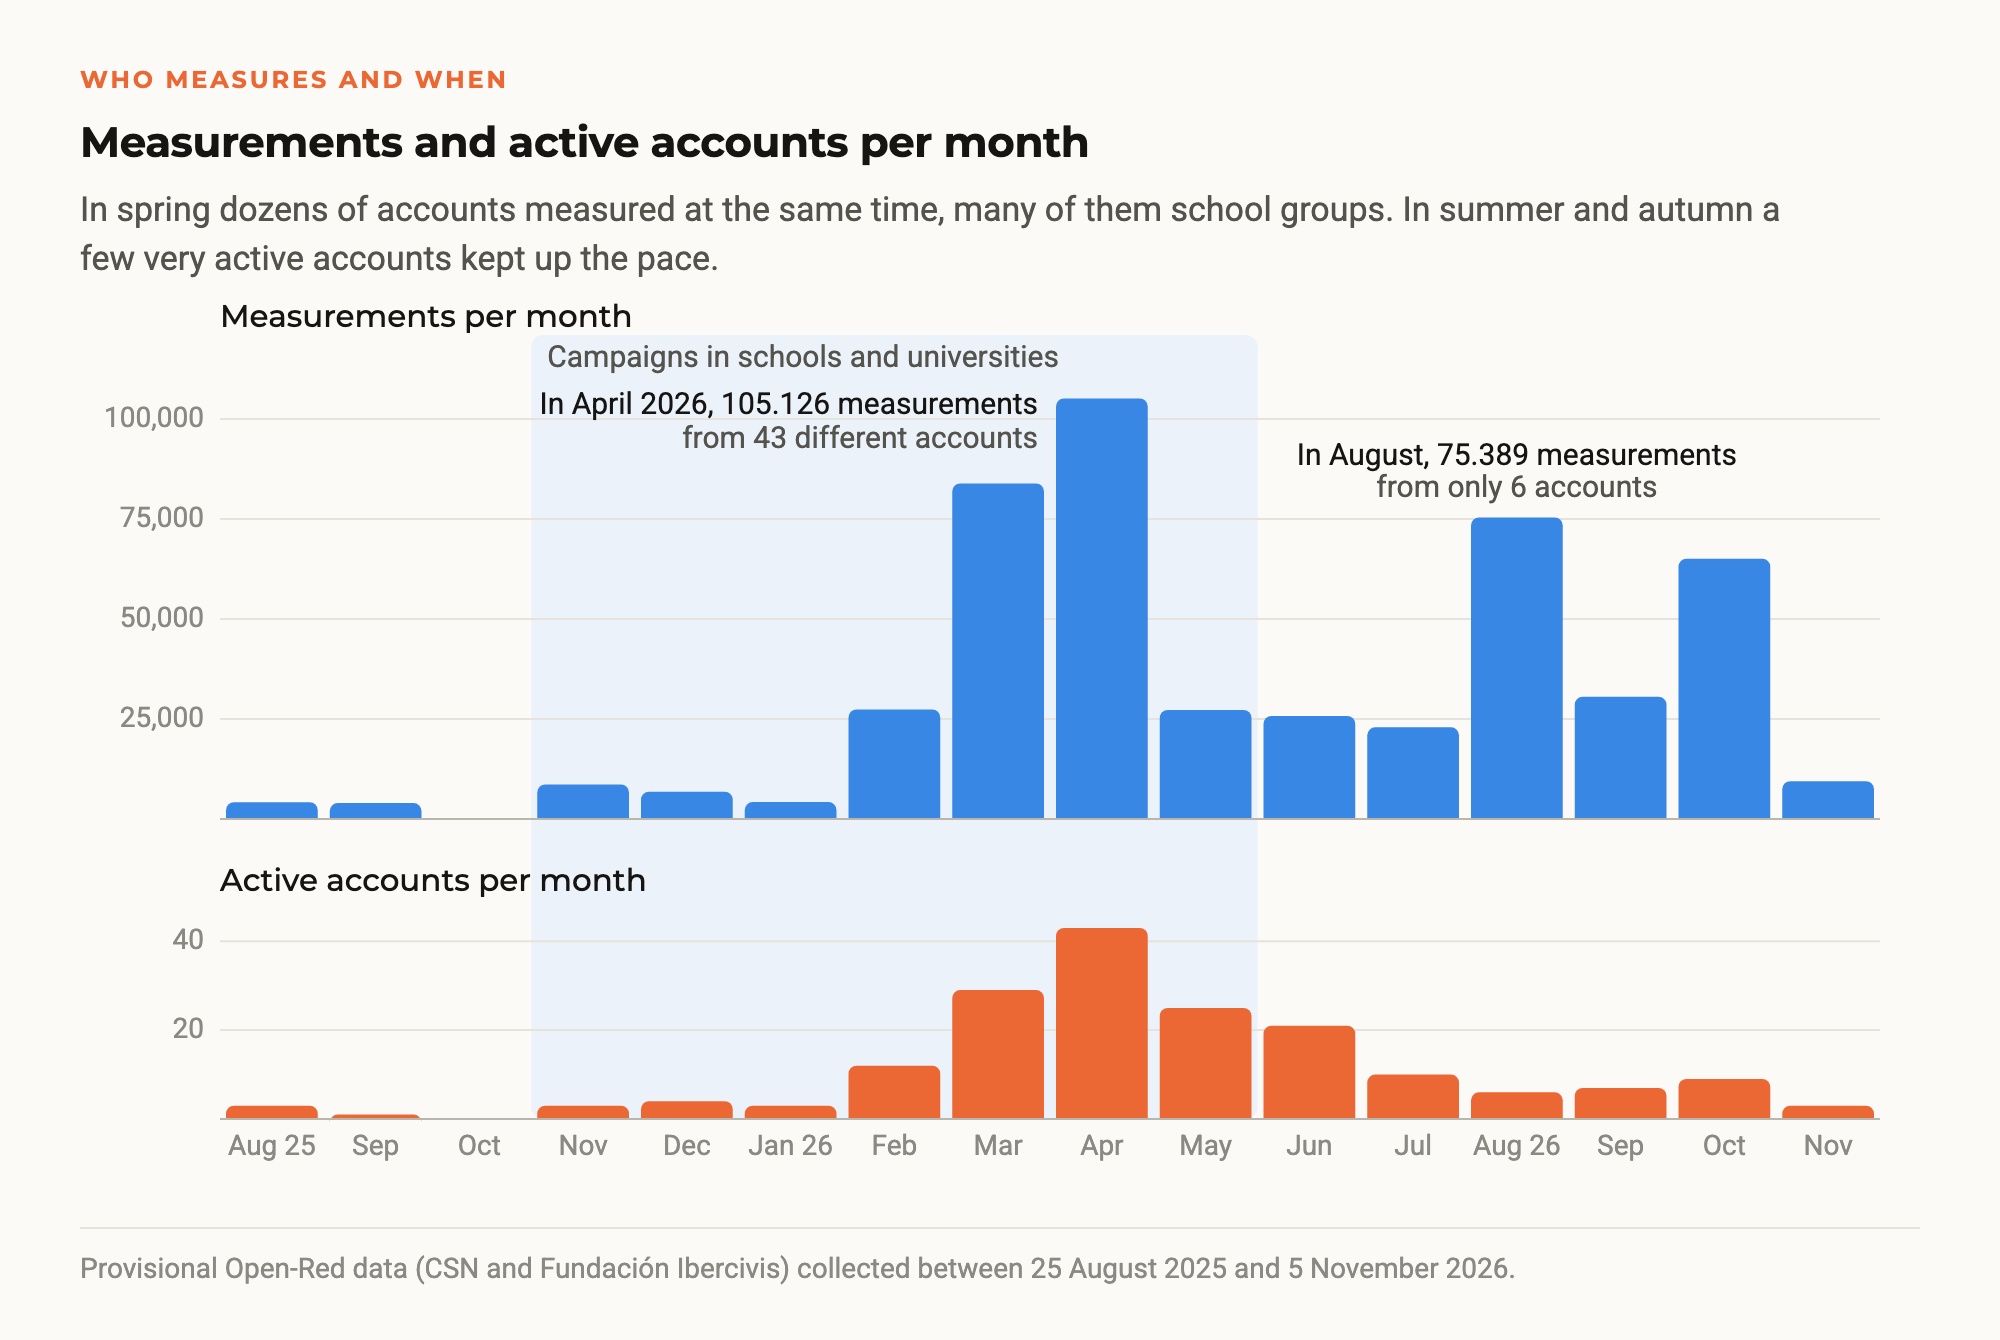
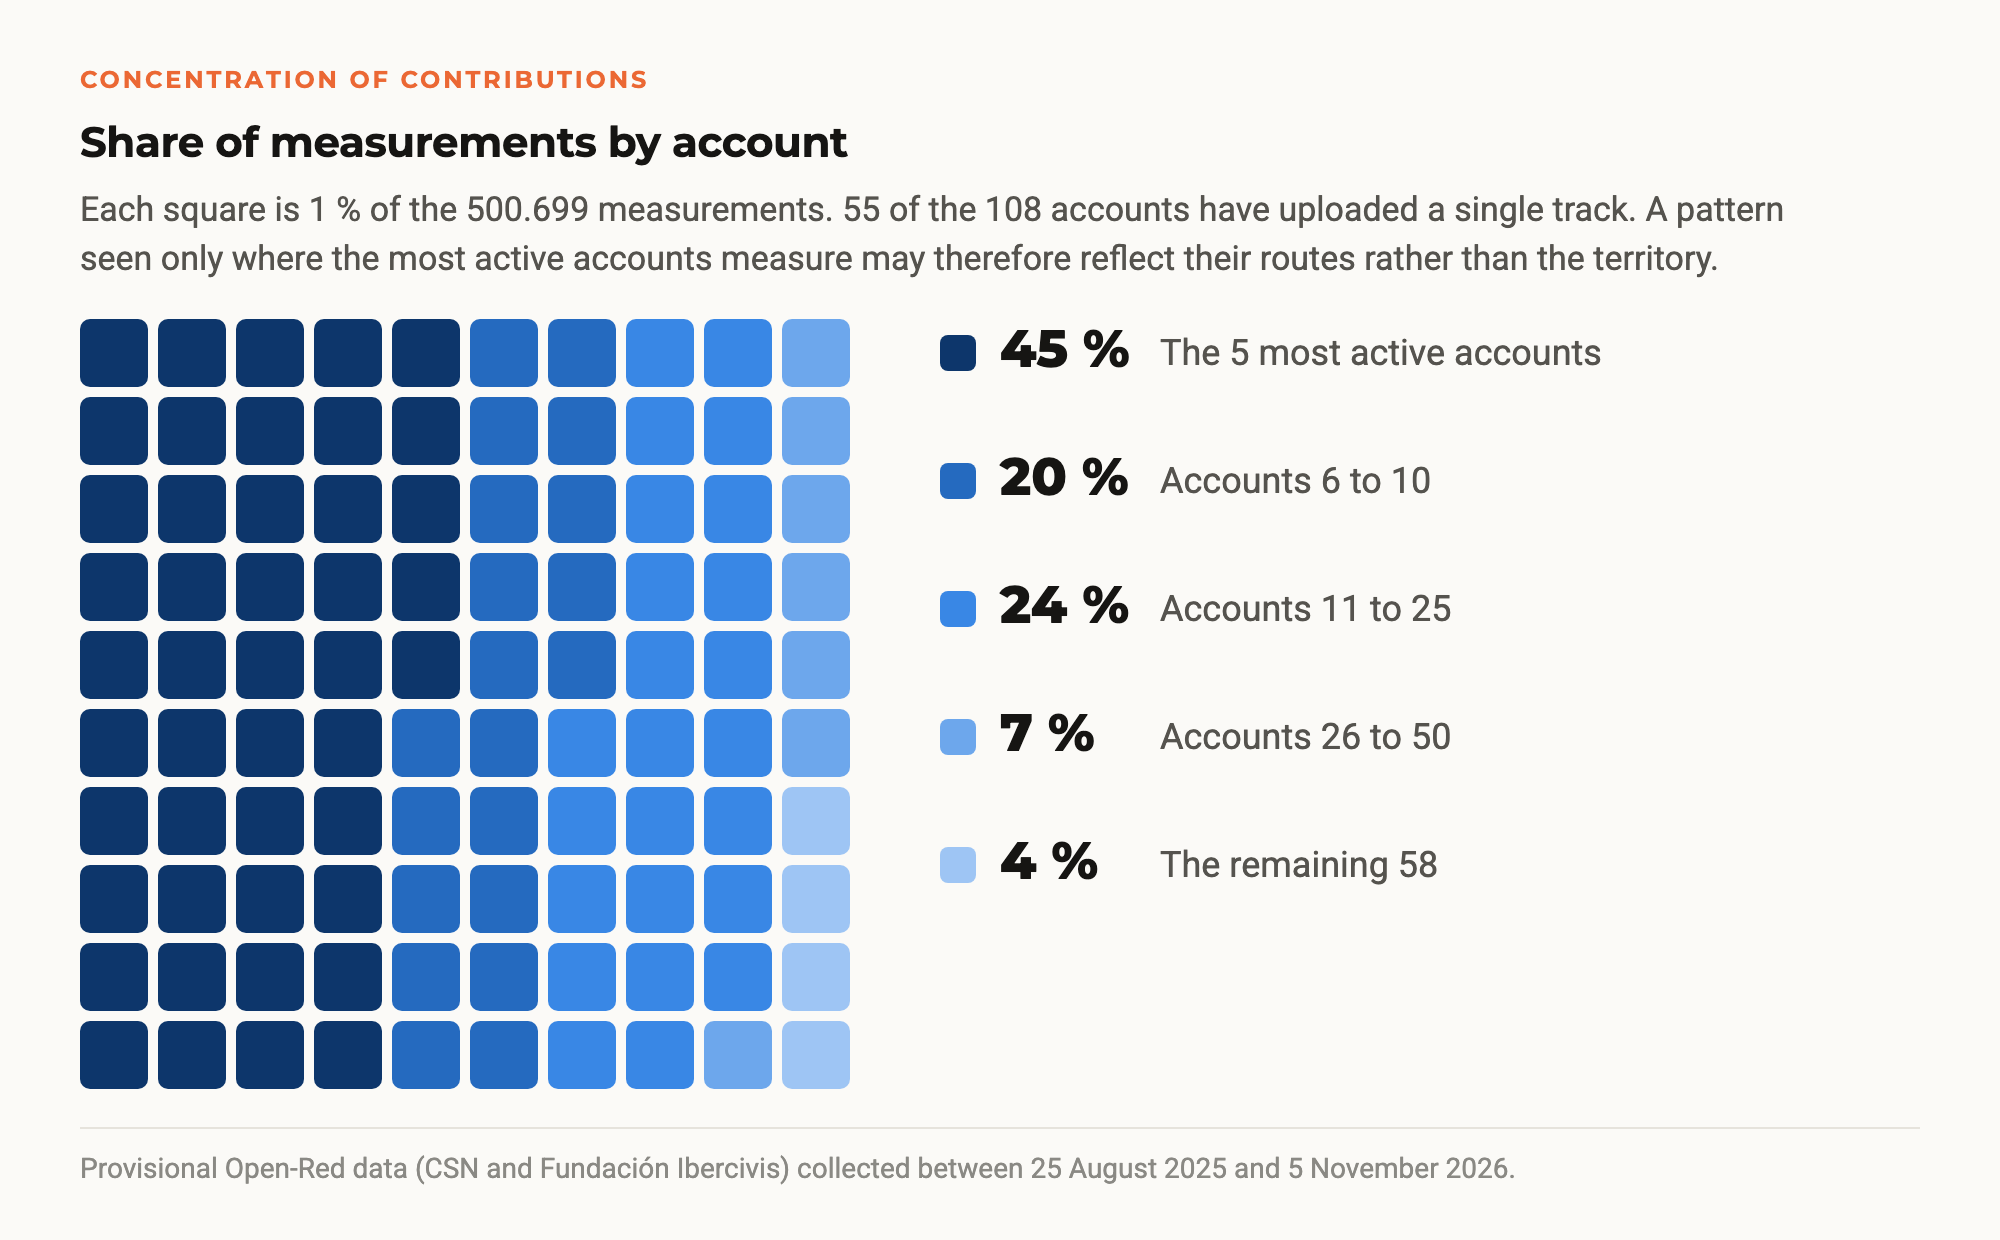
This concentration has consequences. The five most active accounts contribute 45 % of all measurements and the top ten 65 %, while 55 accounts have uploaded a single track. This is an important caveat for the analysis, because a pattern that only appears where the most active people measure may reflect their usual routes rather than the territory.
Data quality
Quality control discarded 5,817 readings, 1.2 % of the total, because of zero doses, impossible values, inaccurate GPS positions or (0, 0) coordinates. The errors include isolated peaks of up to 1,000 µSv/h that do not match the detector’s own count rate. They are calculation errors that a consistency filter at data entry will be able to remove. Almost all measurements come from the same family of detectors, which reduces differences between devices.
The median of all readings is 0.053 microsieverts per hour (µSv/h), and 90 % of the values fall between 0.030 and 0.130 µSv/h.
Values with no health risk
Everything the network has measured is natural background radiation, the radiation present in each place because of its geology and altitude. The differences between areas are real and measurable, but very small in terms of dose. Spending an hour in central Madrid, one of the areas with the highest values, means a little over 0.1 µSv. A chest X-ray means about 20 µSv, and a transatlantic flight several tens. That is why Open-Red’s maps do not use red, which would suggest a danger that does not exist.
Map of the natural background
When only measurements taken on foot or while stationary are plotted, grouped into cells of about five kilometres, a recognisable pattern emerges, with low values on the coast and in limestone areas and higher ones in granite and mountain areas.
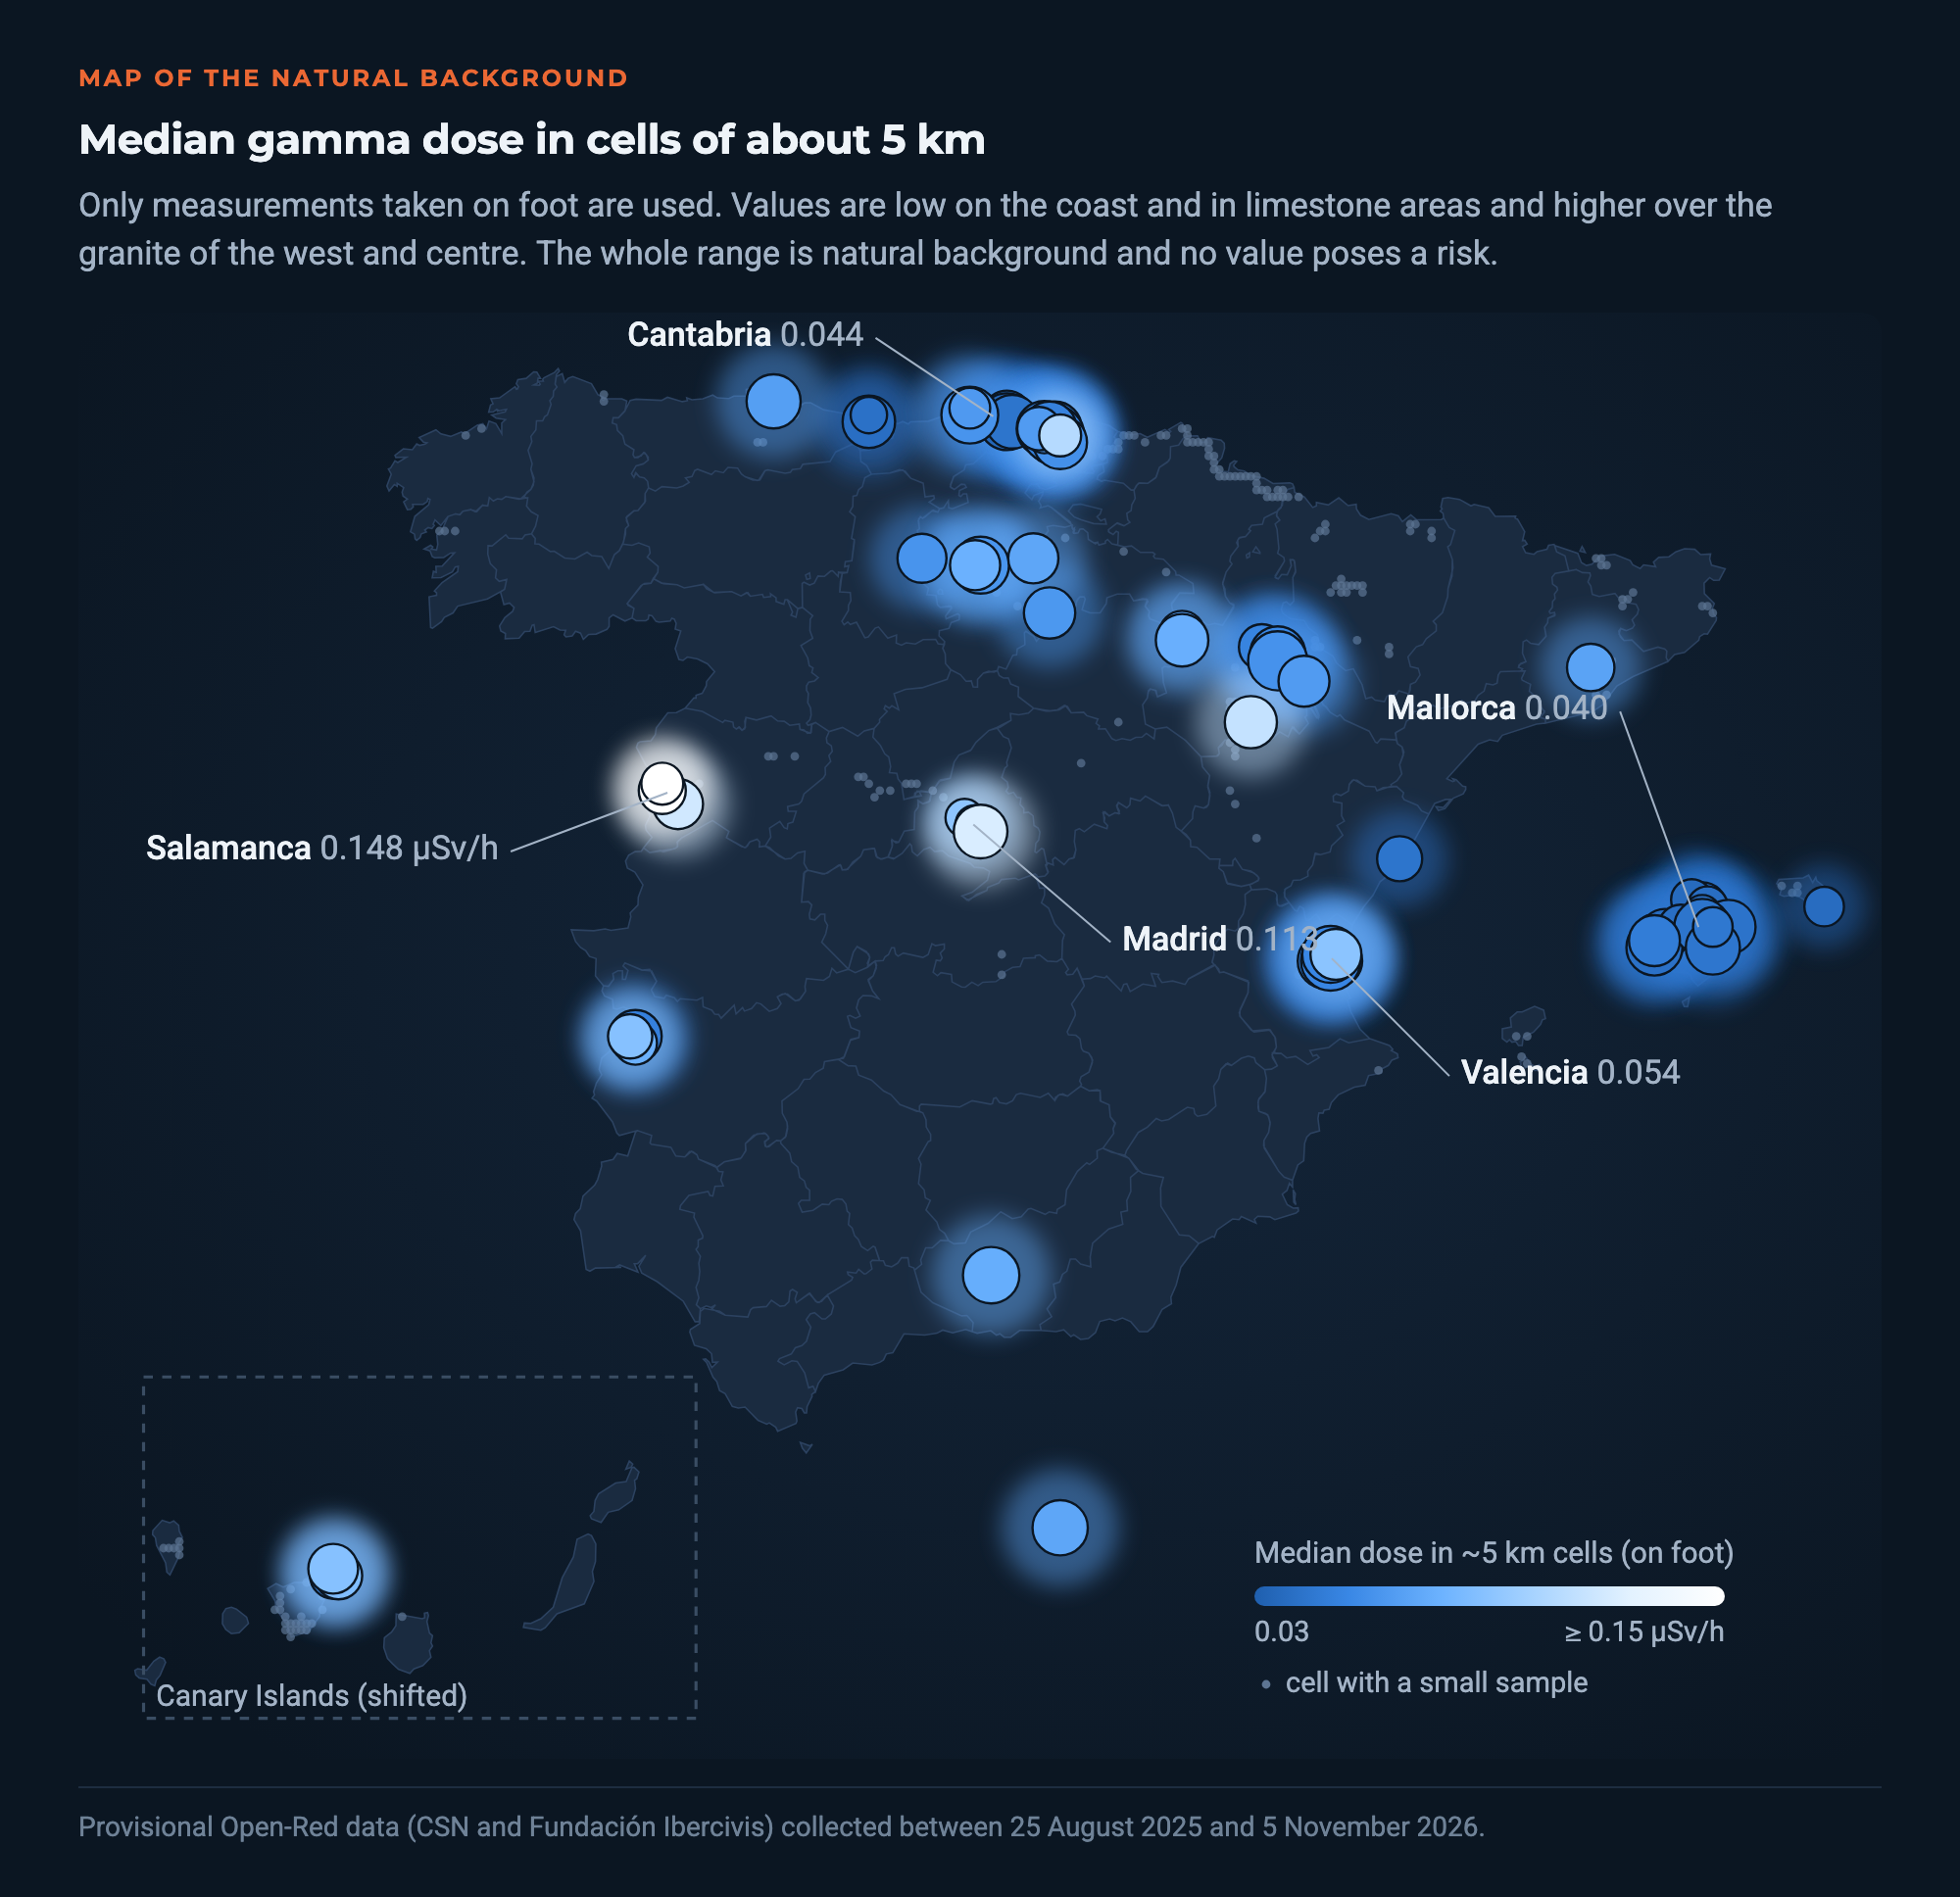
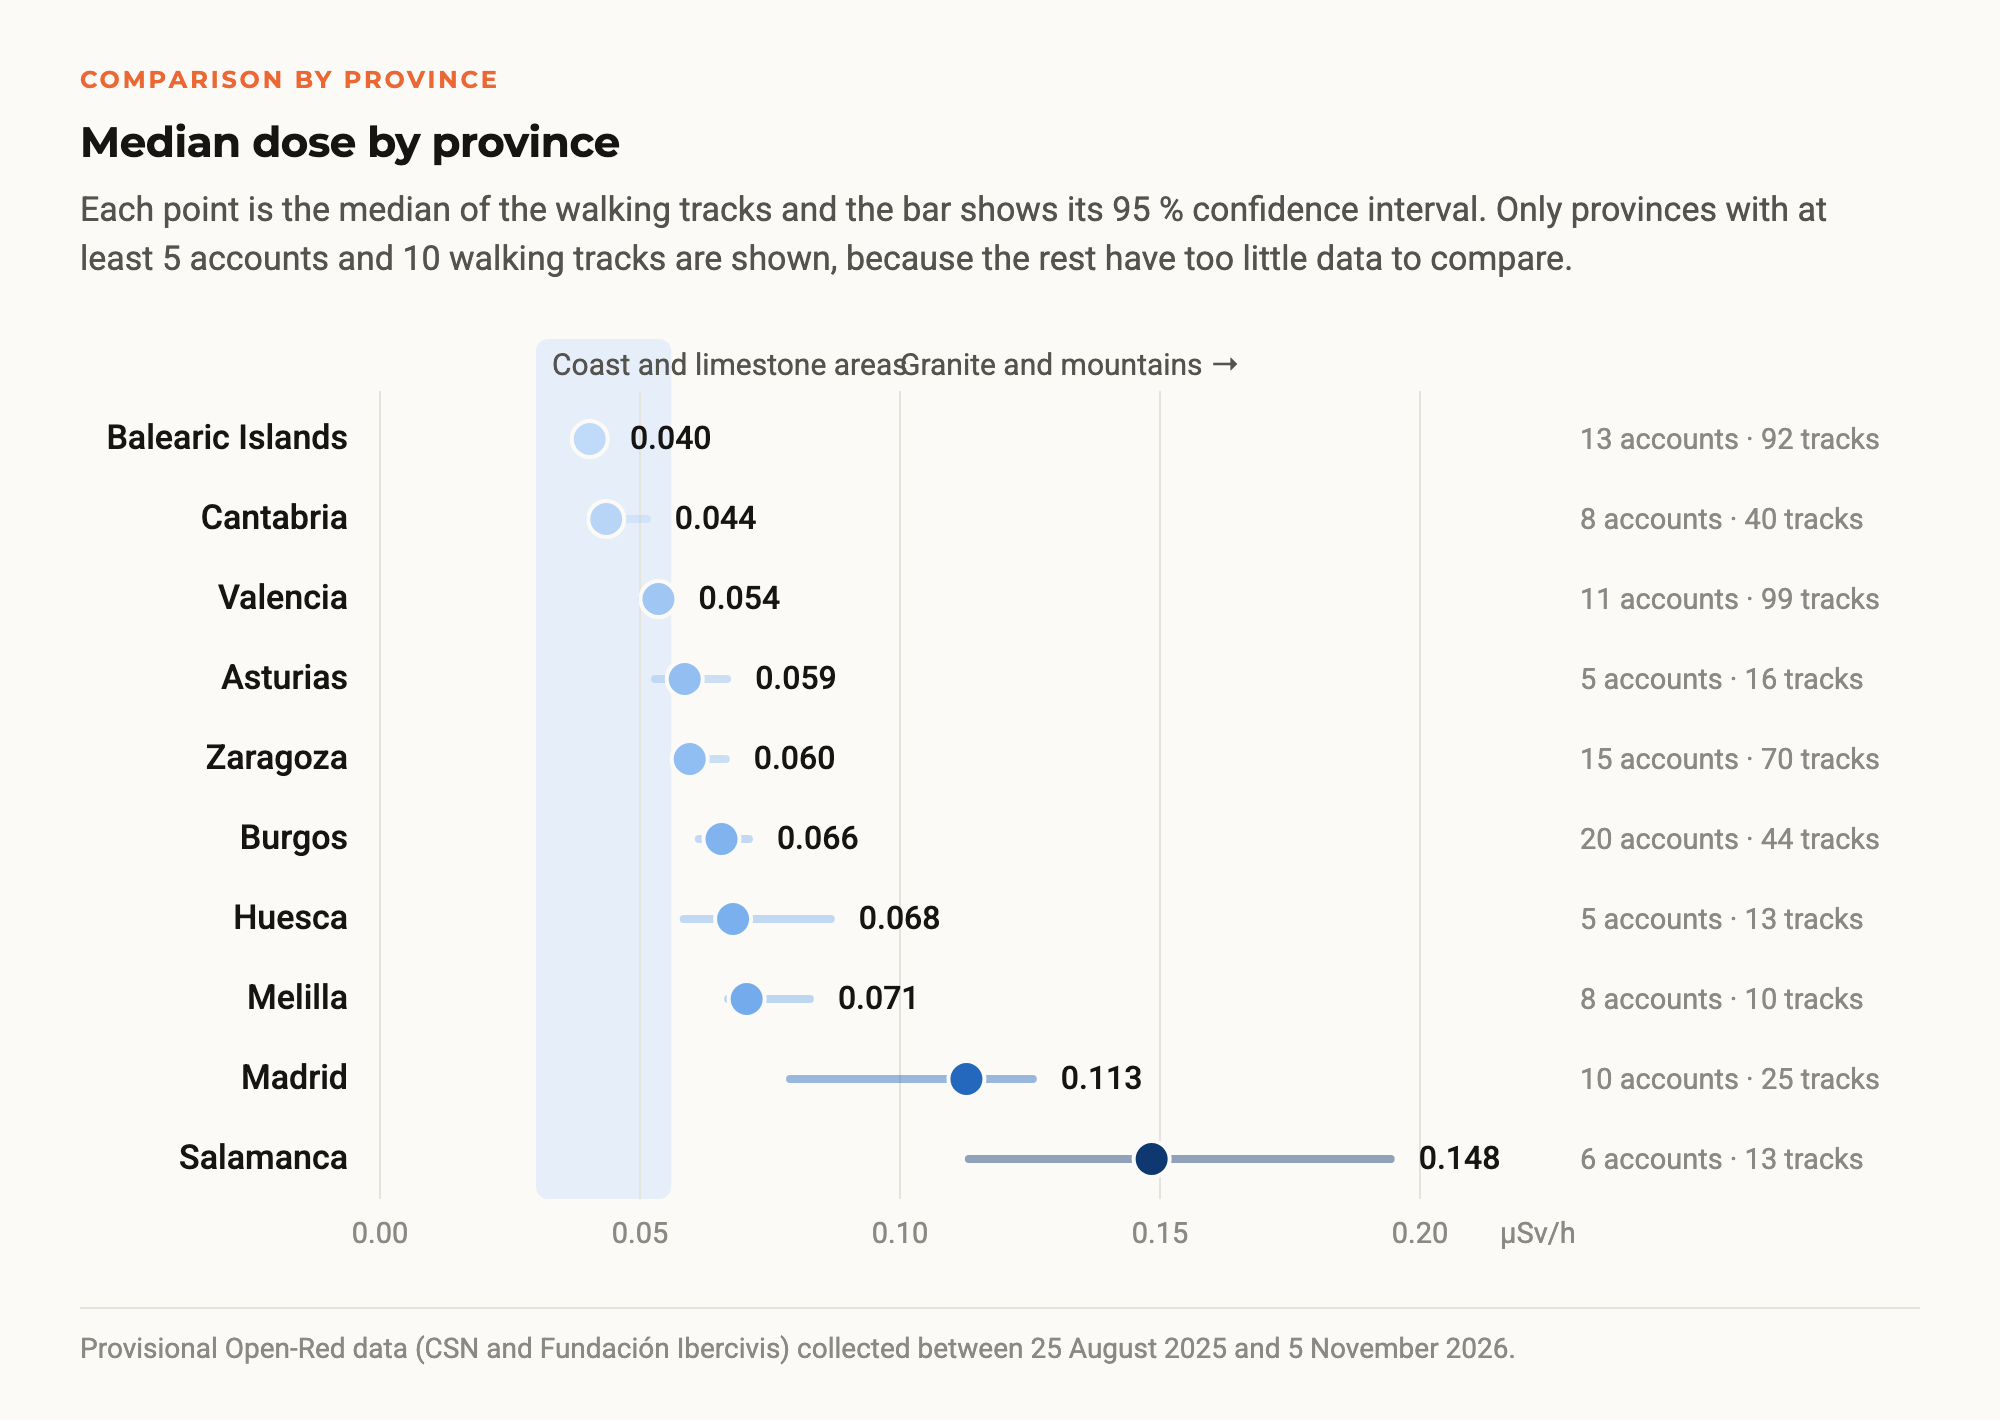
Among the provinces with enough accounts and tracks, the Balearic Islands (0.040 µSv/h), Cantabria (0.044) and Valencia (0.054) are at the low end, while Madrid (0.113) and, above all, Salamanca (0.148) stand out at the high end. This matches what is known about the subsoil, made of limestone and sedimentary rocks in one case and of granites, richer in uranium and thorium, in the other. The authors of the analysis describe this result as “suggestive”, because the map mixes geology with the places each citizen scientist chose to measure.
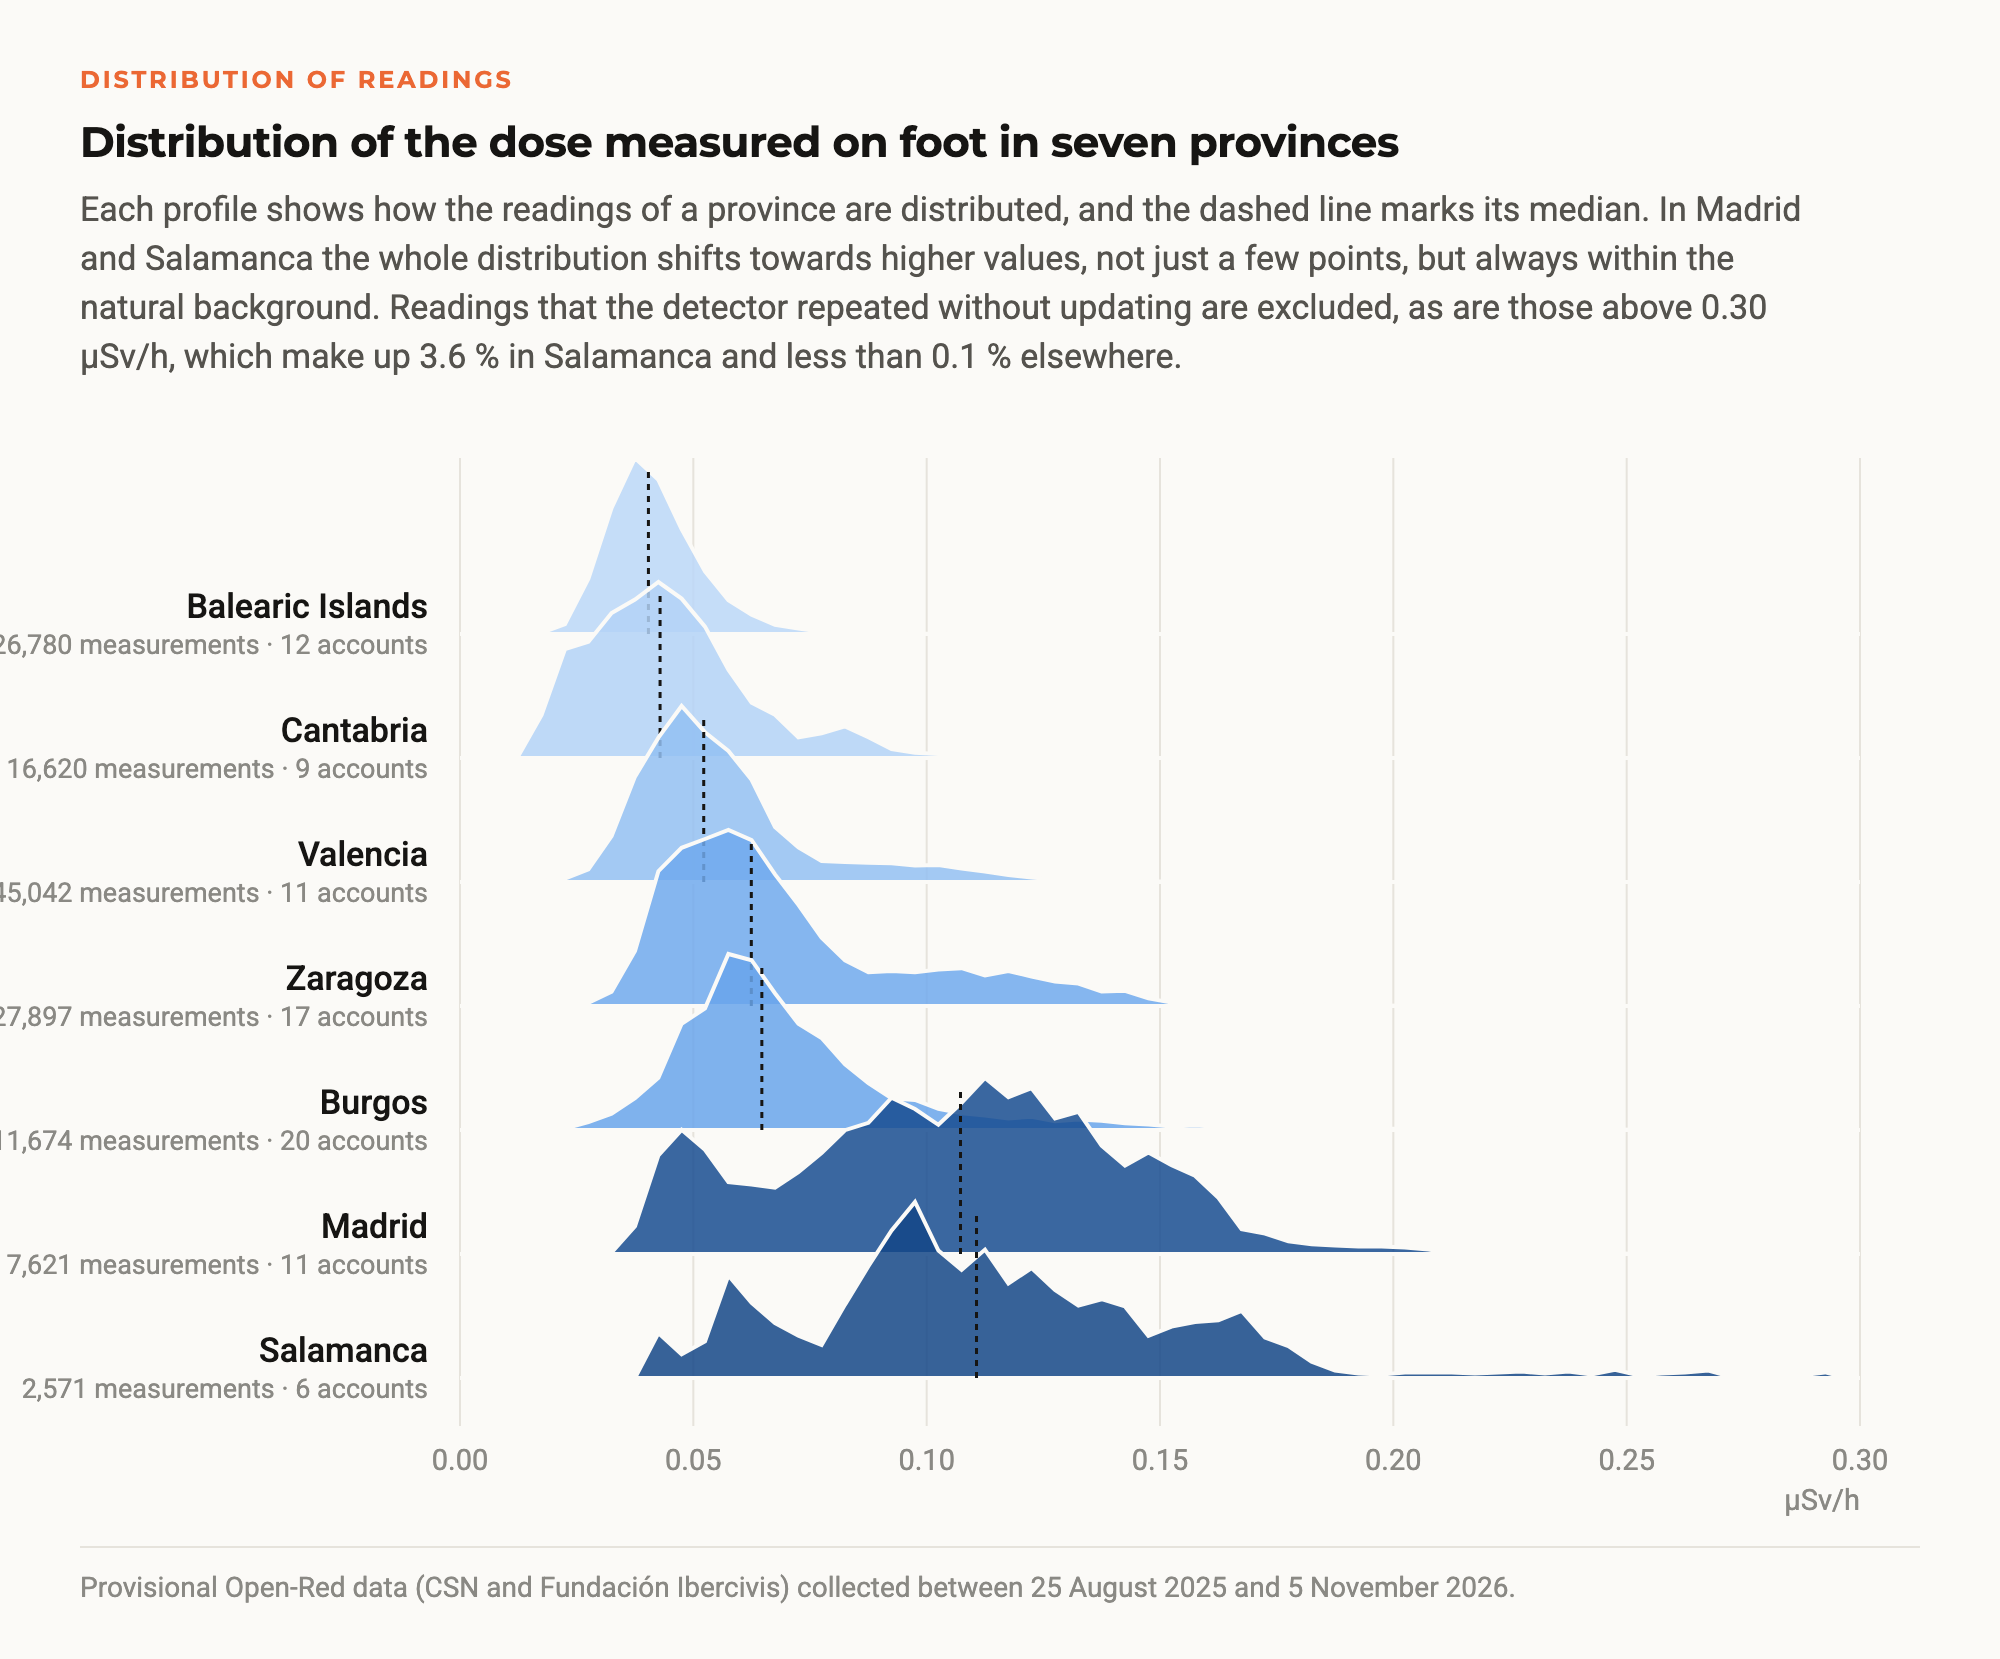
The difference is not down to a few extreme points. Looking at how all the walking readings of each province are distributed, in Madrid and Salamanca the whole distribution shifts towards higher values, while in the Balearic Islands and Cantabria almost all readings stay below 0.08 µSv/h. Madrid shows two groups, one around 0.05 µSv/h and another around 0.12, which corresponds to the city centre.
Madrid
Madrid deserves a separate mention. With 13,041 measurements and 31 tracks from 12 accounts it is not the most measured province, but the city centre, where the Matadero campaign took place in May 2026, is the cell in the whole network covered by the largest number of different accounts. Ten accounts measured it in 15 tracks and 3,670 measurements. Its median, 0.122 µSv/h, is more than twice that of all measurements, and among the provinces with enough data only Salamanca is higher than Madrid. Because it has been measured by many people with different devices, it is one of the most reliable high values in the dataset.
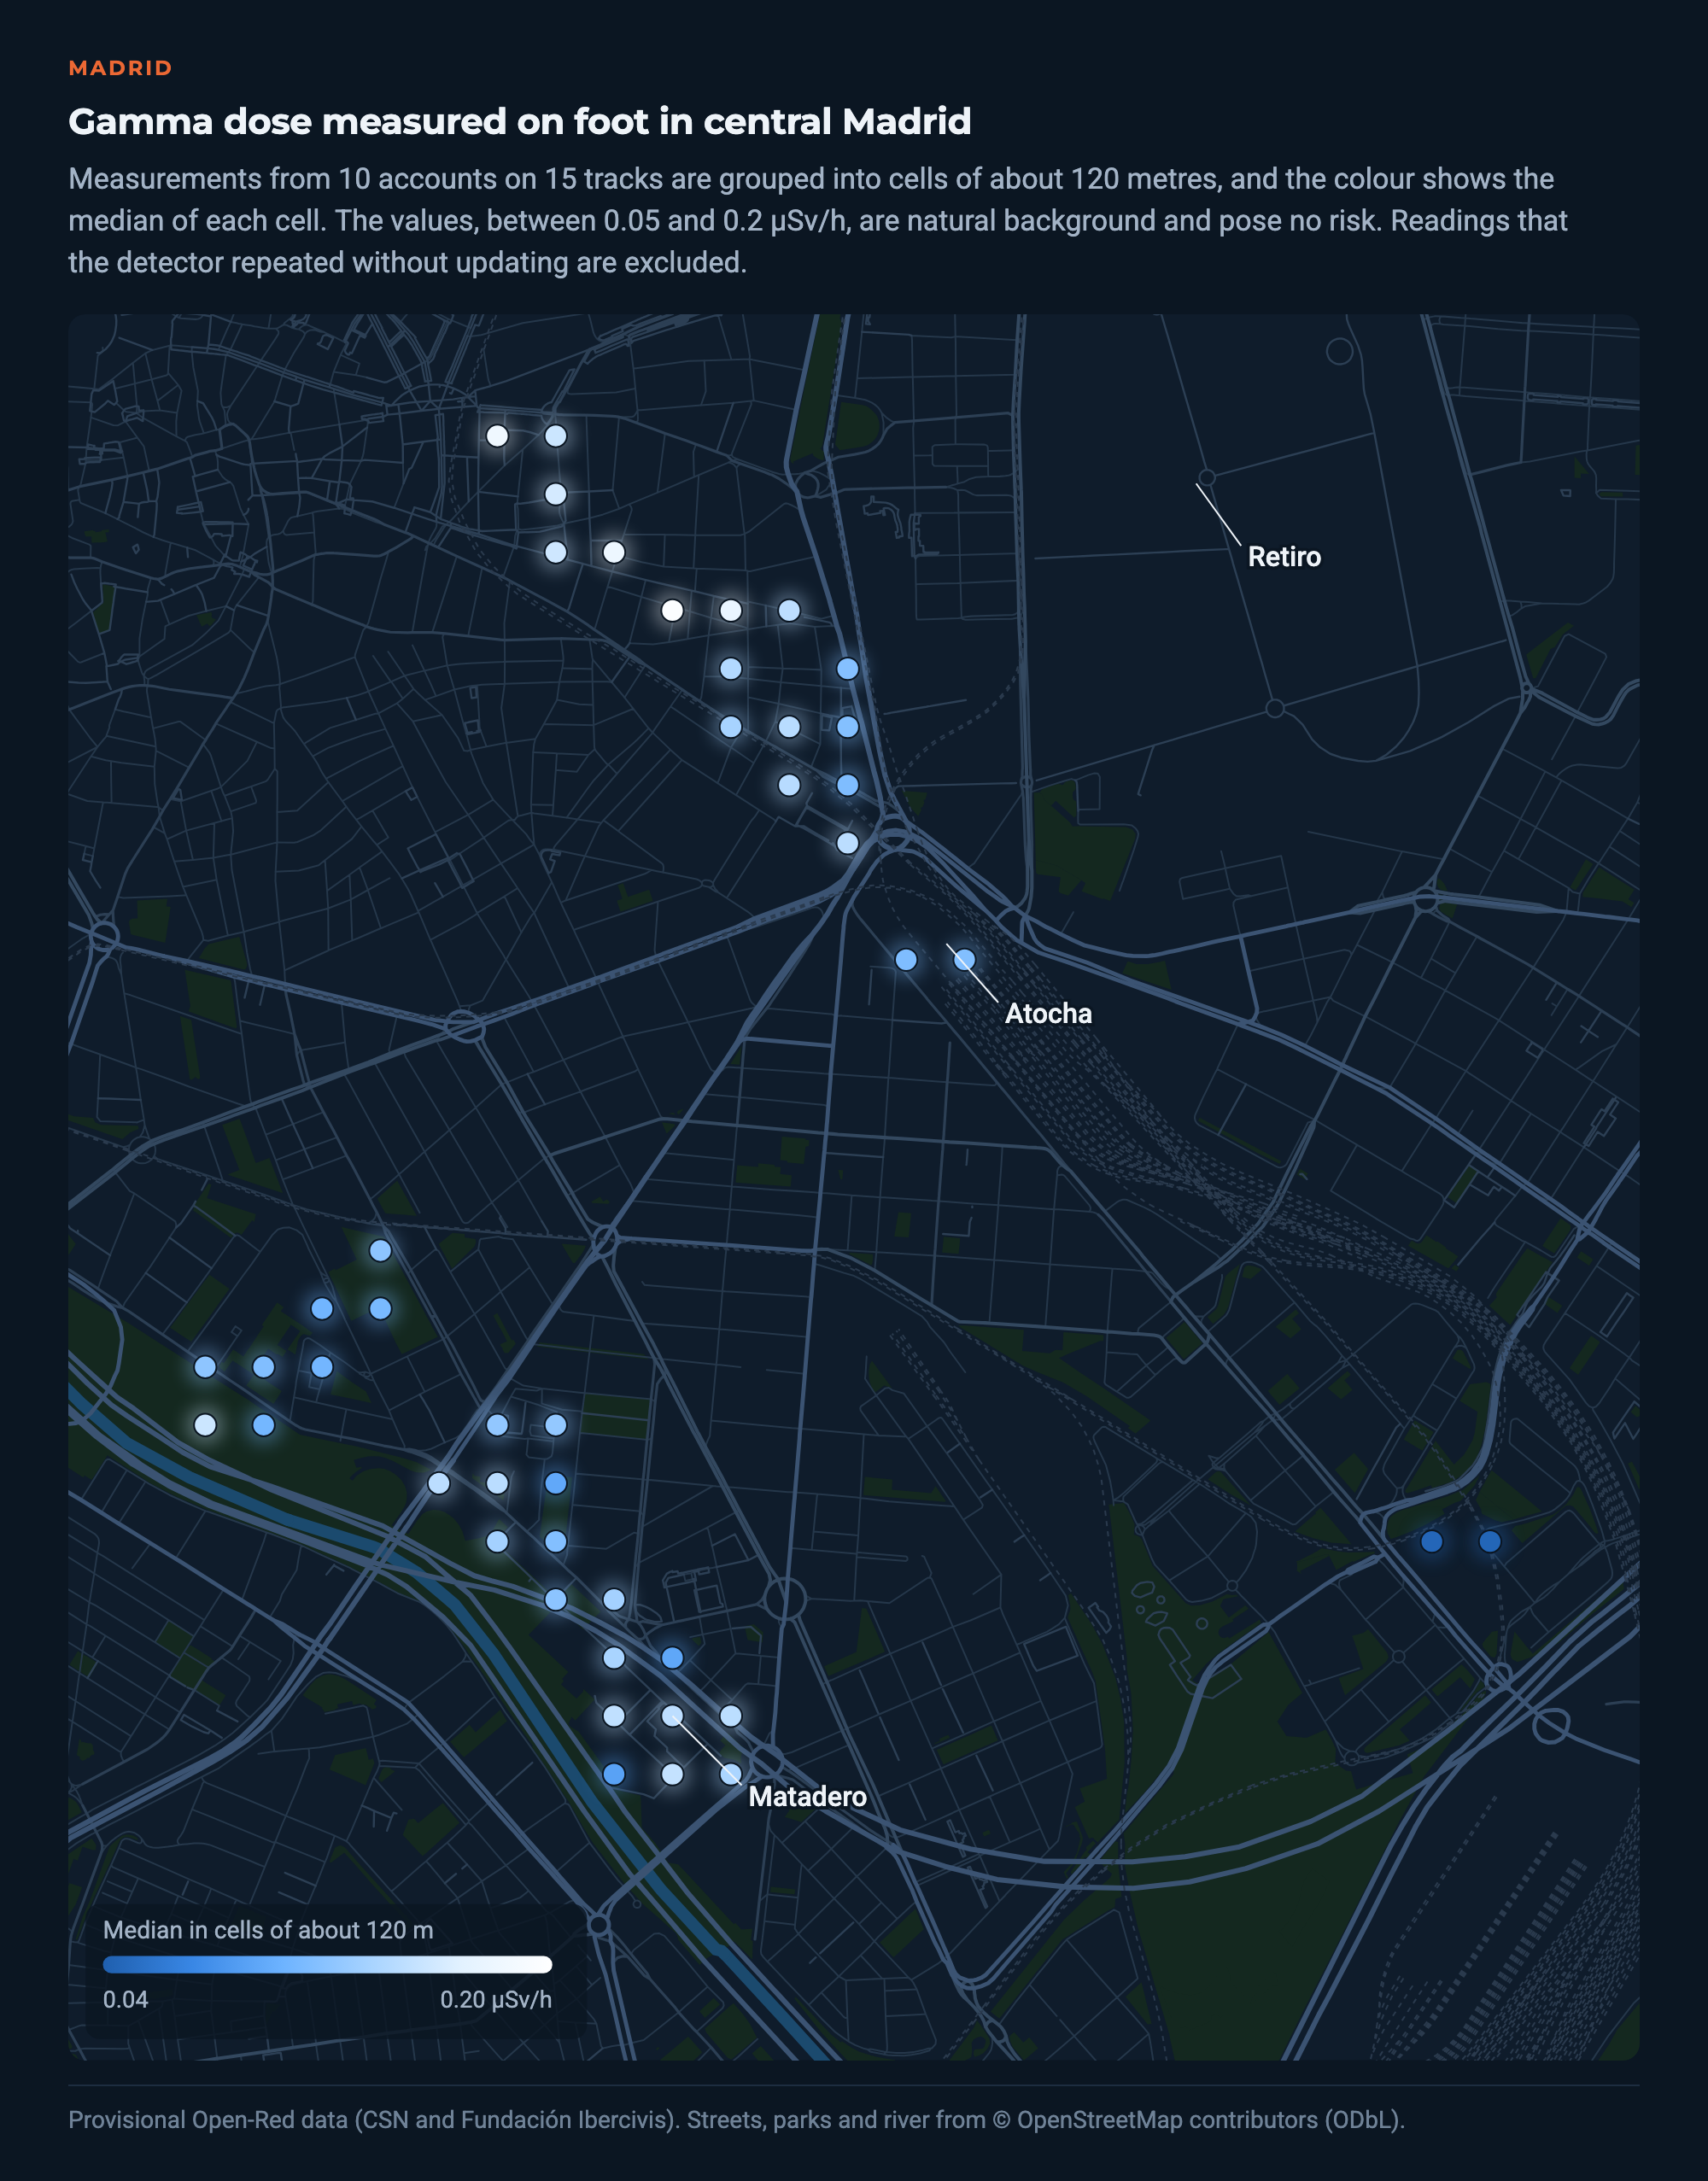
The most likely explanation is geological. Much of Madrid’s subsoil consists of sands from the erosion of the granite of the Sierra de Guadarrama, and granite is also common in buildings, kerbs and paving. The Spanish Natural Radiation Map (MARNA) already assigns the area a higher background. A median of 0.12 µSv/h is a normal value for a city built on that ground and poses no risk at all.
Villar de la Yegua
The most striking area is Villar de la Yegua, in the Ciudad Rodrigo district of Salamanca, a territory with natural uranium mineralisation. On 9 May 2026, during the local campaign, a rock outcrop was measured twice, and three different detectors covered it. All three read higher the closer they get to the rock. Within 30 metres their medians range from 0.17 to 0.34 µSv/h, and beyond 100 metres they drop to 0.14–0.18 µSv/h, still above the rest of the province (0.123).
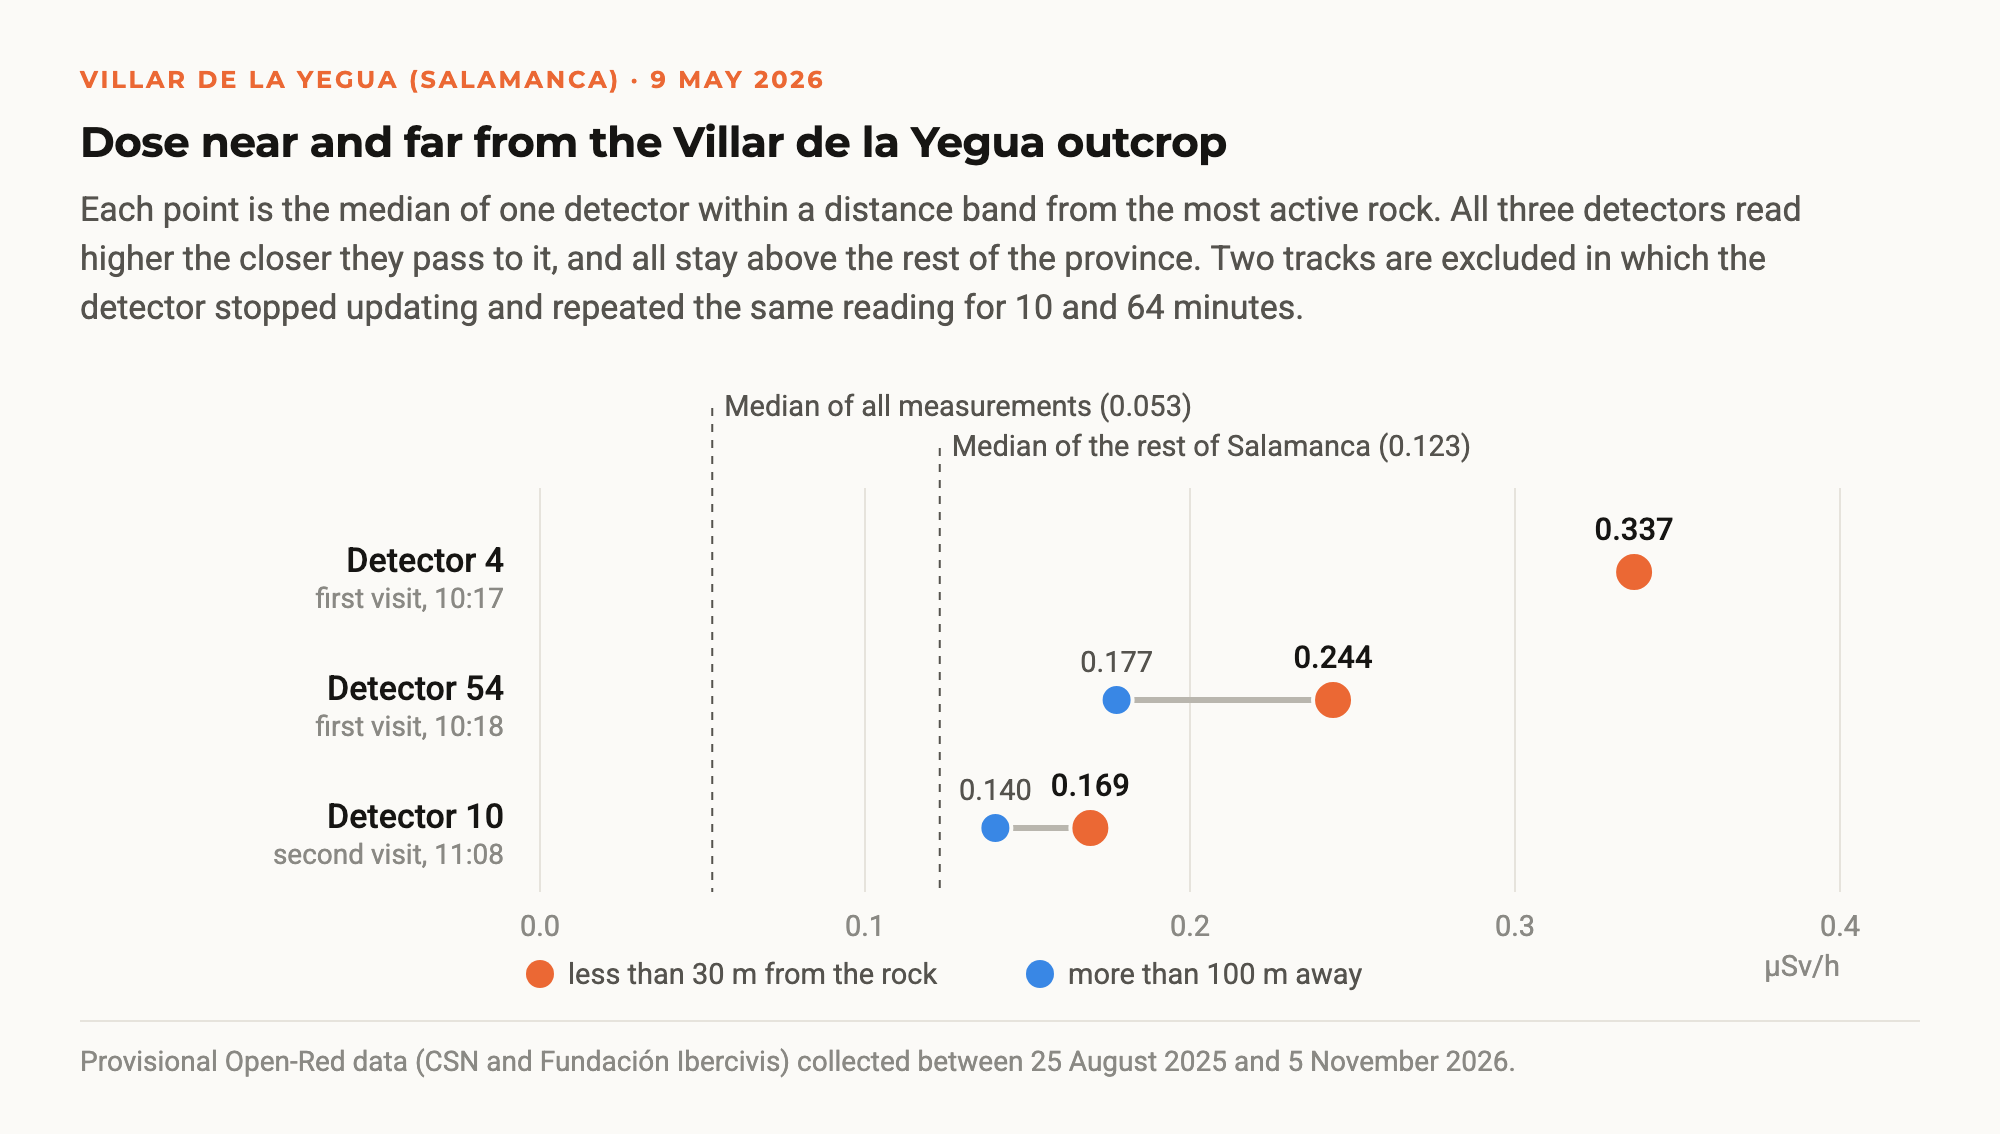
The differences between detectors are not caused by the devices. When several detectors really measure the same spot, their medians differ by 10 % to 17 %. At Villar de la Yegua what changes is each person’s route and the time spent next to the rock, and in a mineralised area a few metres change the reading. The analysis also leaves out two tracks in which the detector stopped updating and repeated the same value for 10 and 64 minutes.
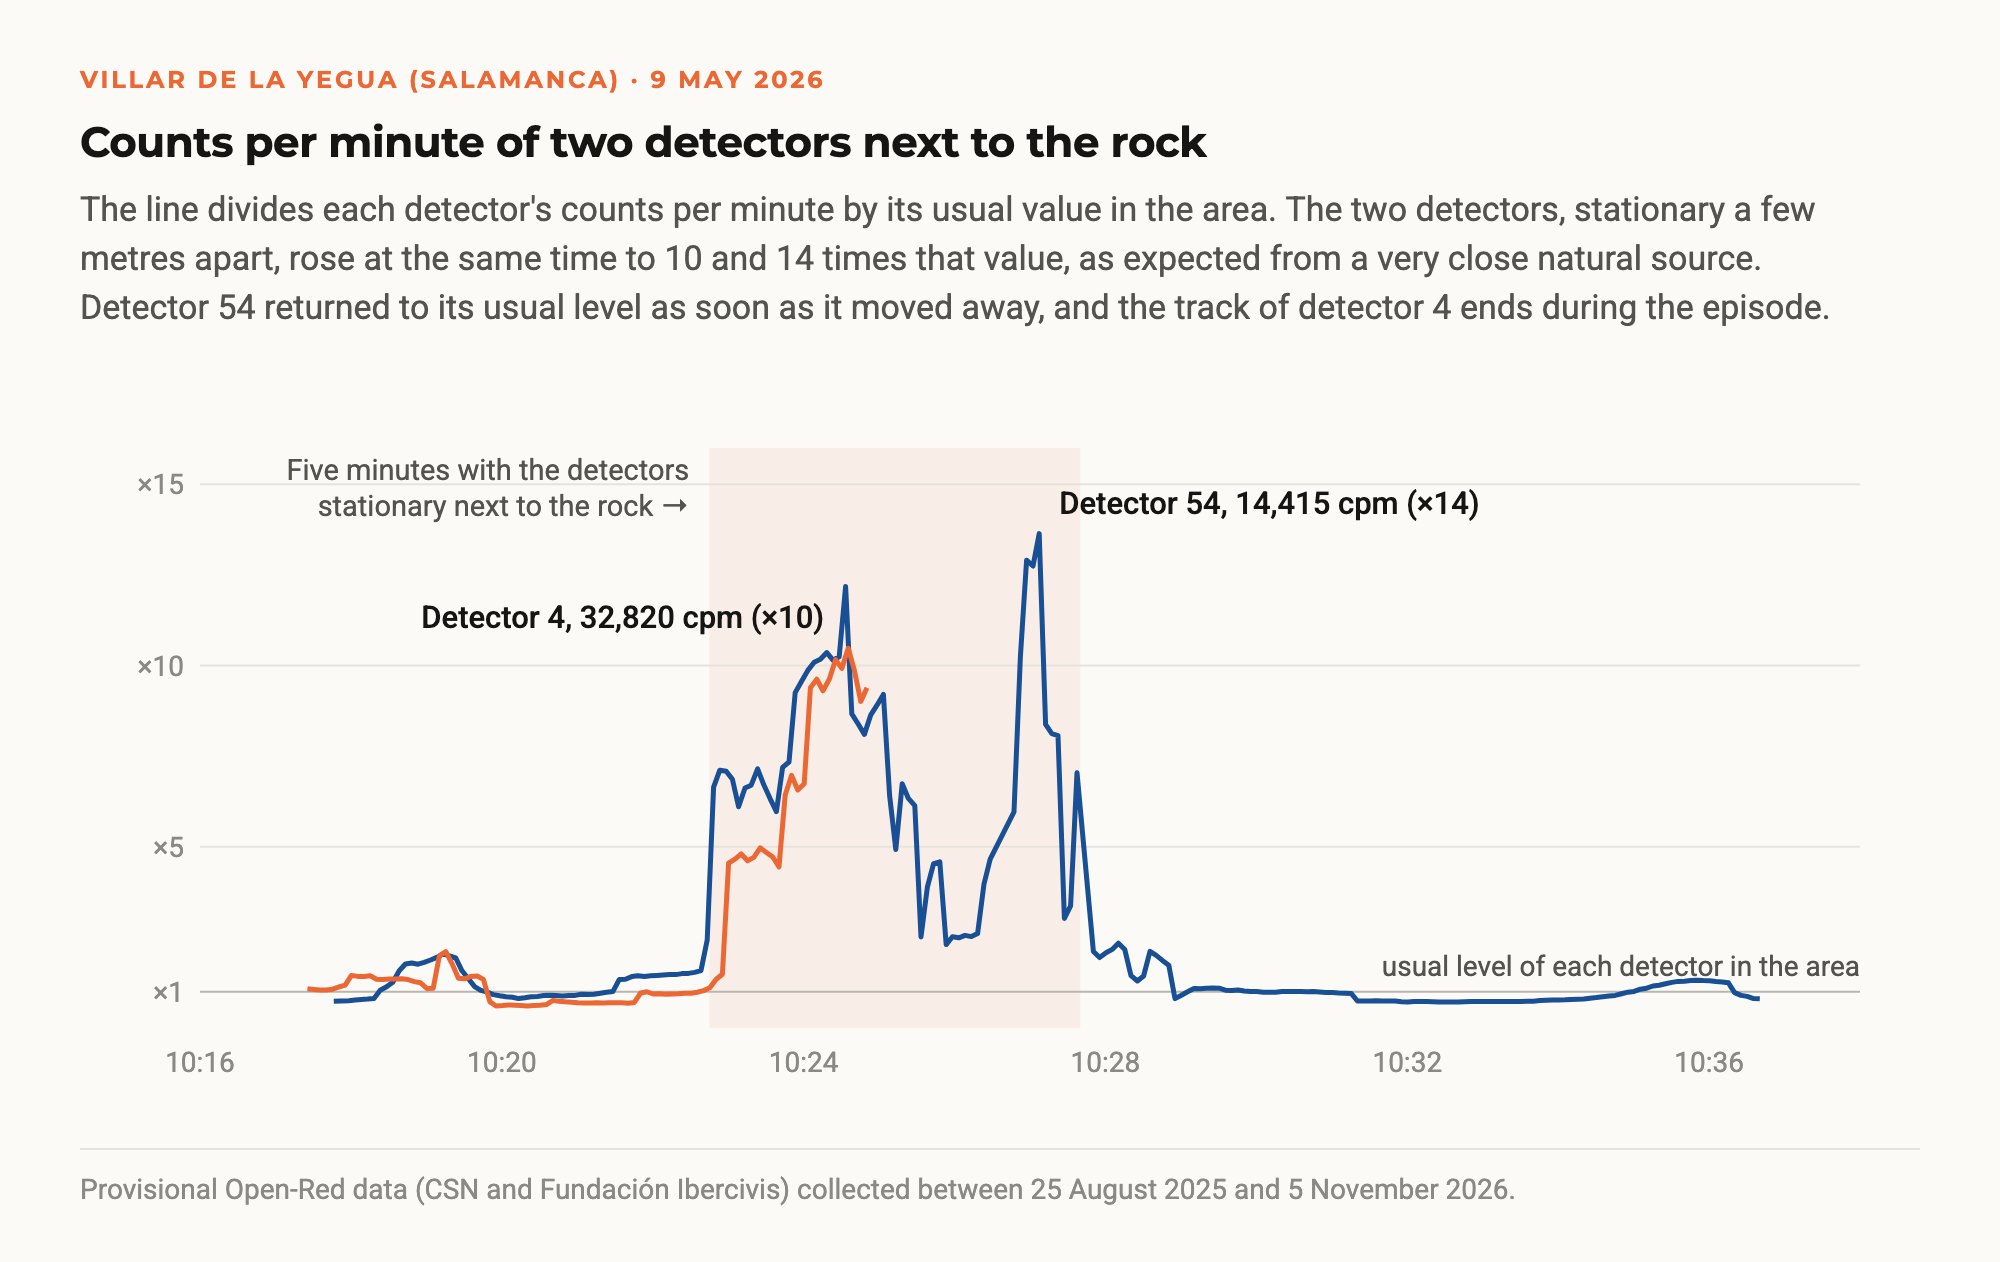
For five minutes, two detectors stationary next to the rock, a few metres apart, simultaneously recorded 10 to 14 times more counts per minute than usual in the area. This is the signature of a very close natural source, almost certainly the rock itself. The dose rate corresponding to those counts is around 3 µSv/h. One of the devices displayed values of up to 200 µSv/h, but they do not match its own counts and are the same kind of calculation error that quality control removes in the rest of the network. Staying those five minutes next to the rock means about 0.25 µSv, roughly eighty times less than a chest X-ray.

Other areas measured again and again confirm the picture. In Ciudad Rodrigo, eight tracks from four accounts give between 0.10 and 0.15 µSv/h. At the opposite end are the coast of Cantabria and Mallorca, with 0.03–0.04 µSv/h.
How mode of travel and altitude matter
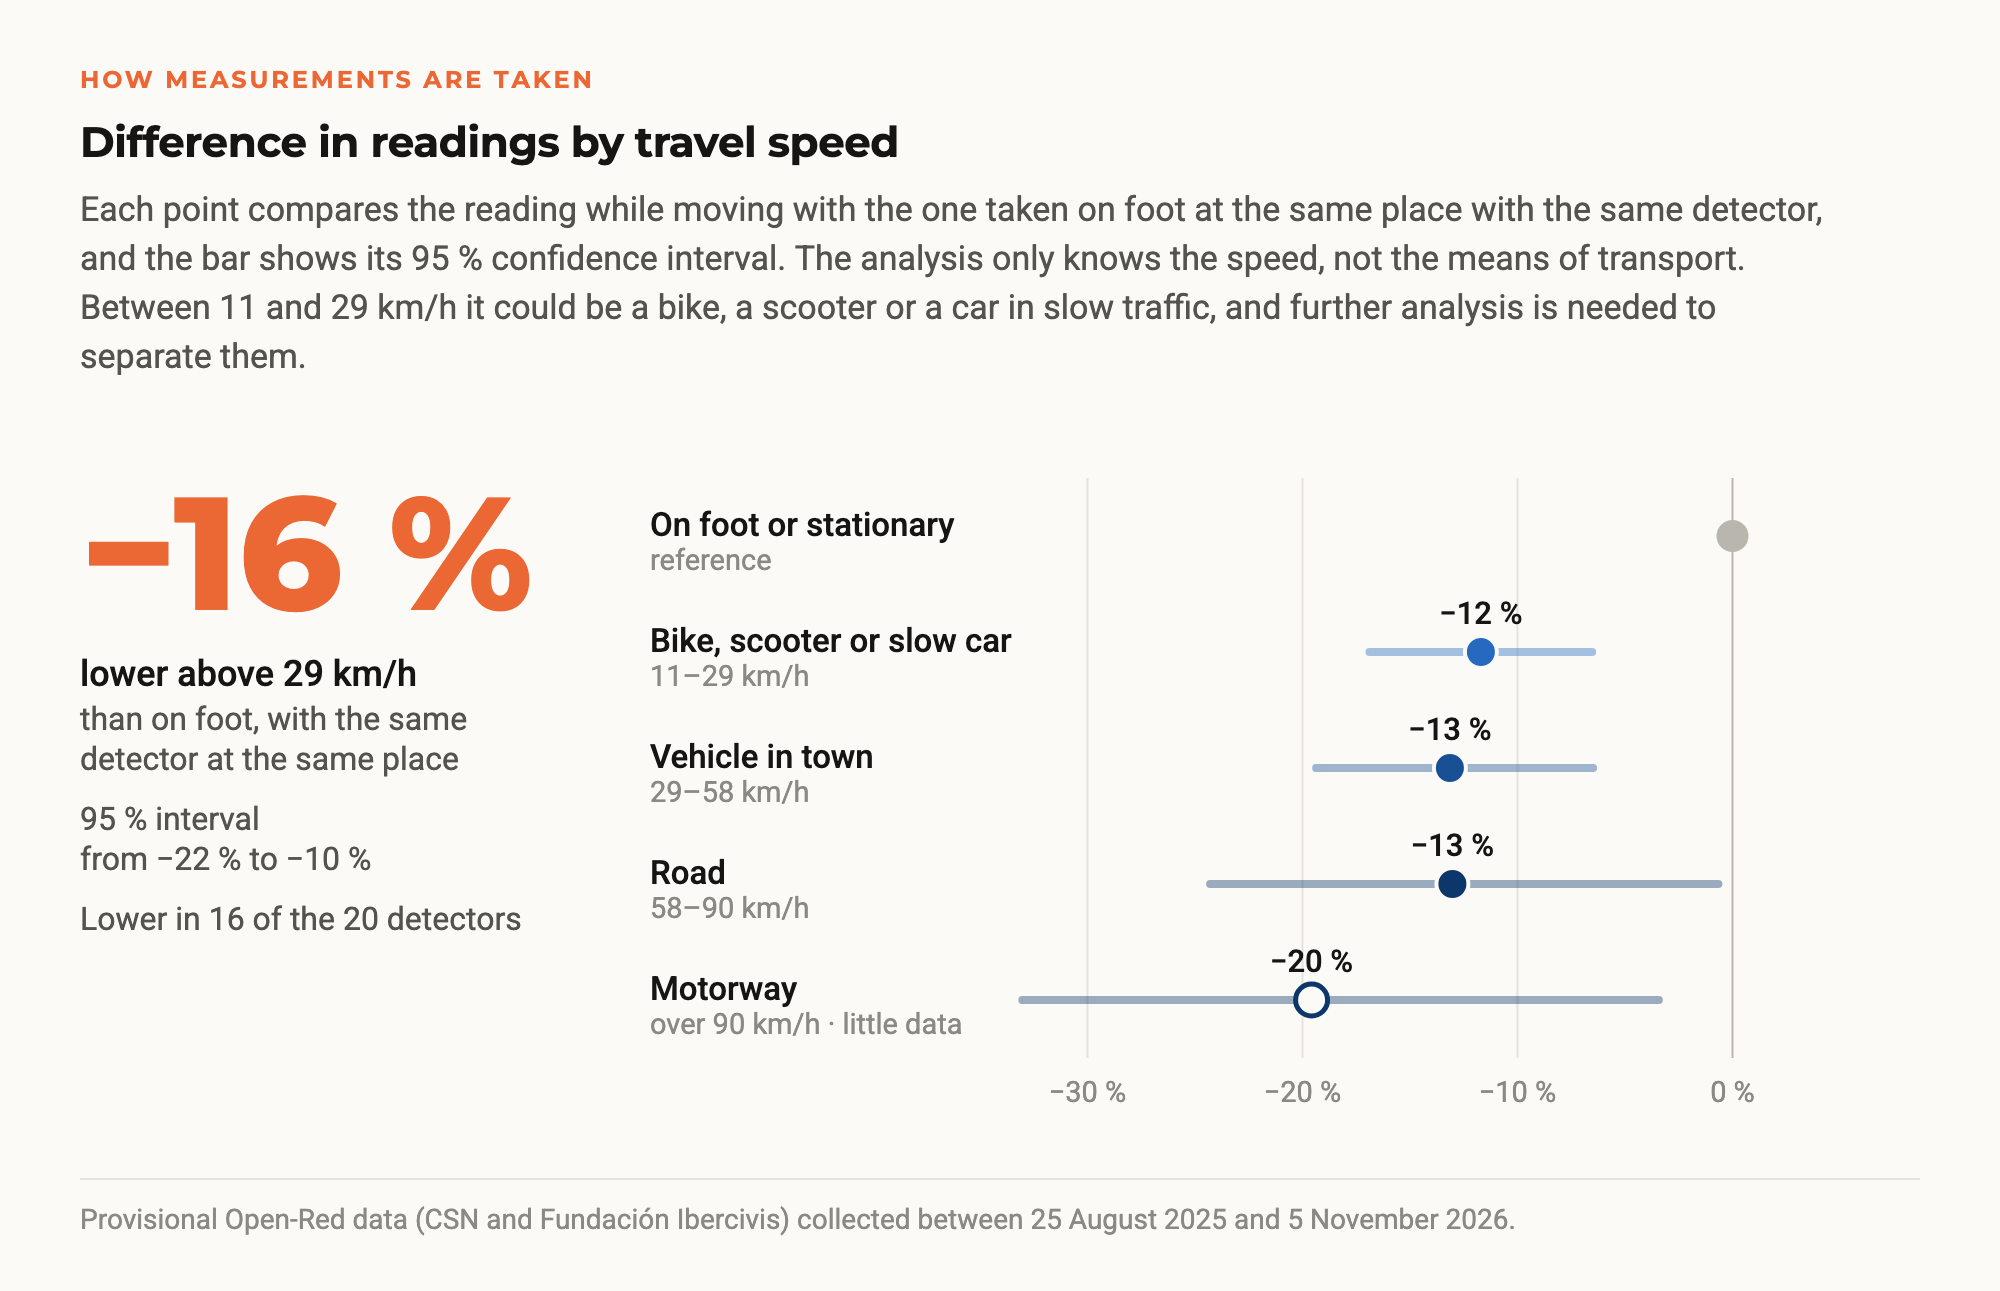
Before comparing areas, the way measurements are taken must be taken into account. With the same detector and at the same place, measuring at more than 29 km/h, almost always from a vehicle, gives 16 % less than on foot, with a 95 % confidence interval from −22 % to −10 %, and the difference appears in 16 of the 20 devices analysed. Between 11 and 29 km/h the reading already drops by 12 %. The analysis only knows the speed recorded by the GPS, not the means of transport, and at those speeds a person could be on a bike, a scooter or in a car in slow traffic. Further analysis will be needed to separate them and to find out whether the difference is due to the shielding of the vehicle body, the type of surface or the way the detector is carried. It is one of the most robust results of the analysis, and that is why the map has been built only with measurements taken on foot or while stationary.
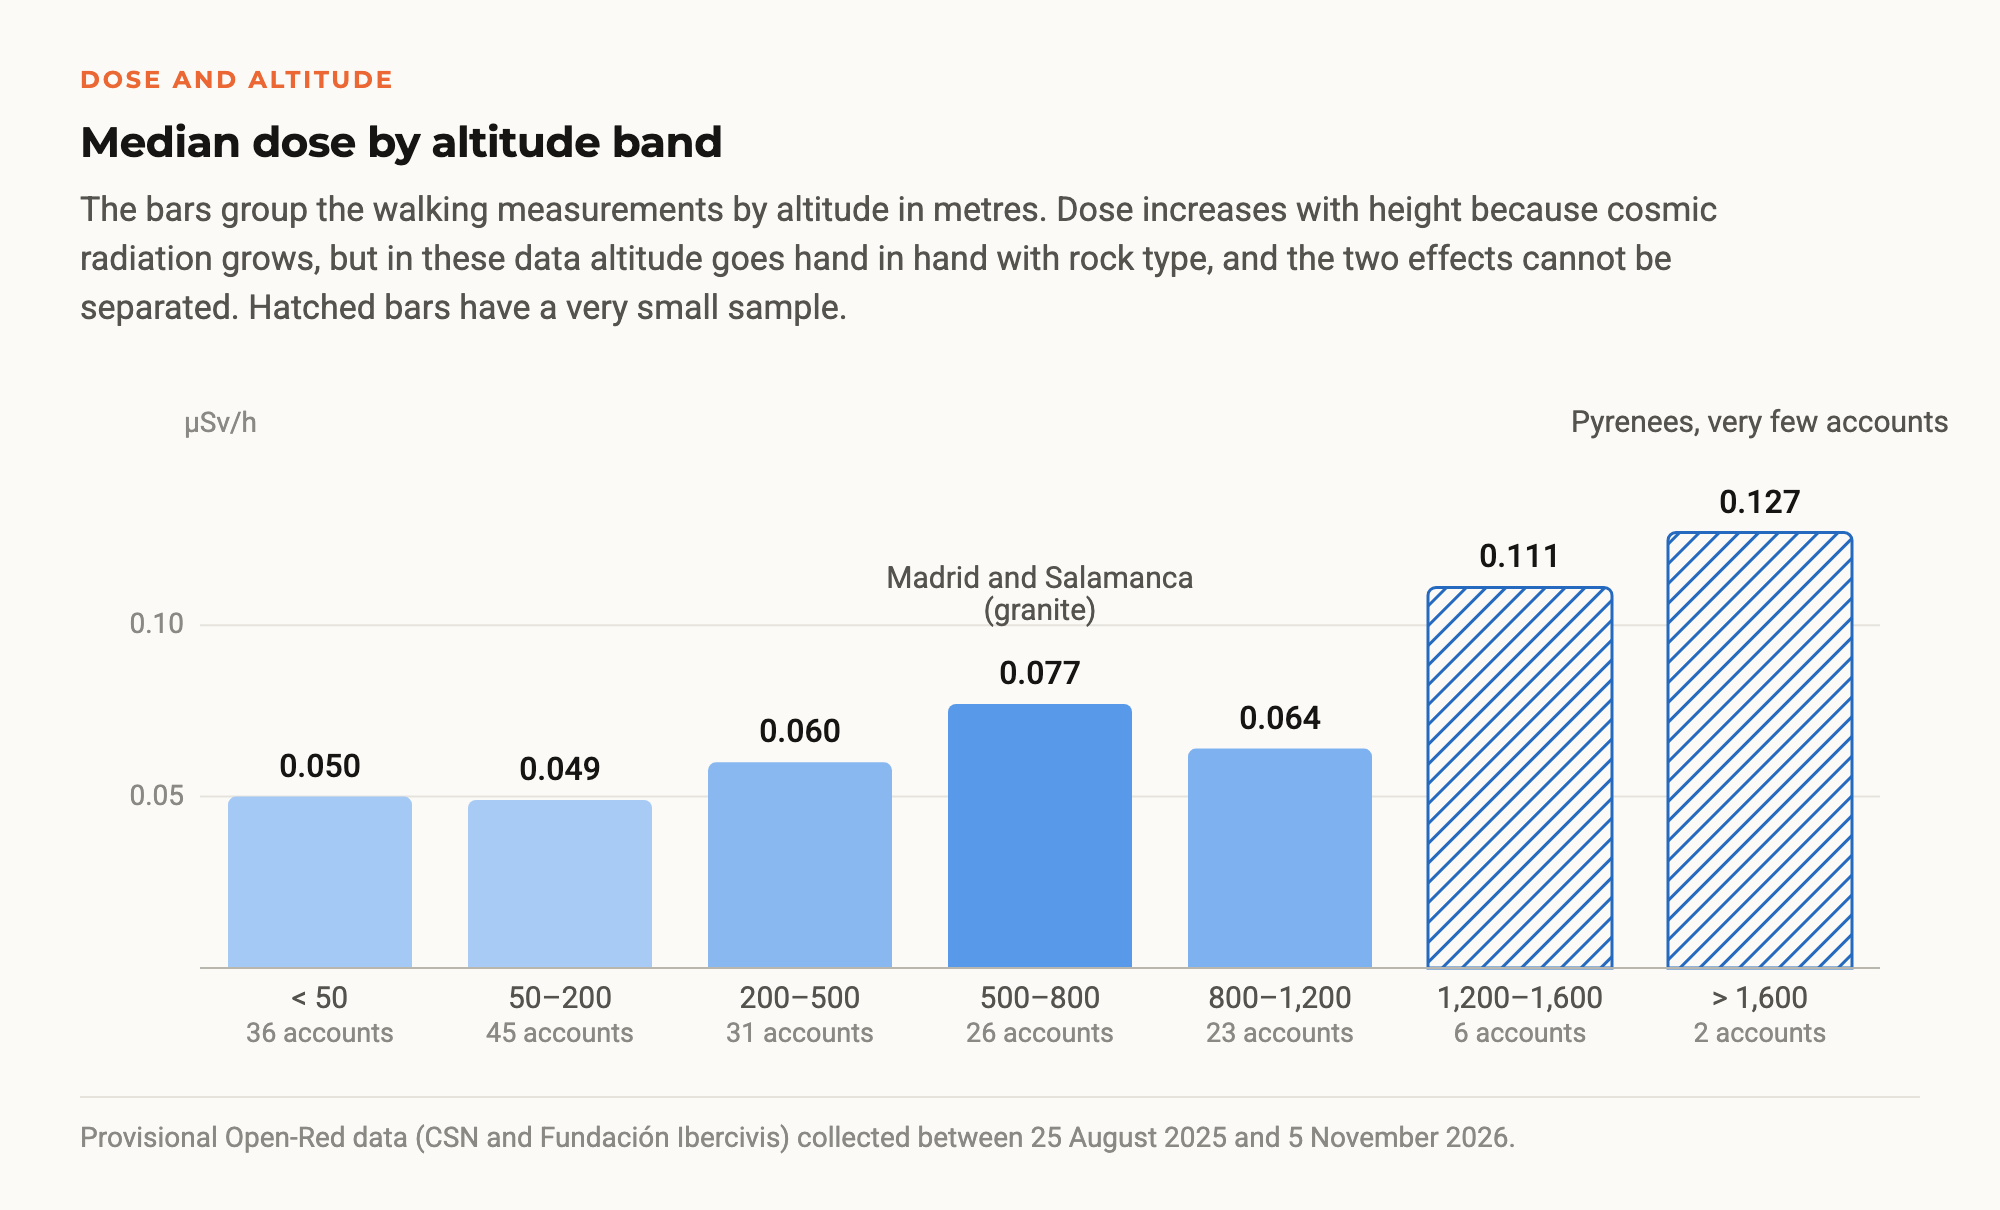
Dose also increases with altitude, as expected from cosmic rays. But in these data height goes hand in hand with geology. Madrid and Salamanca lie between 500 and 800 metres, and above 1,600 metres almost everything is in the Pyrenees, so with what has been measured so far the two effects cannot be separated.
Influence of weather and time of day
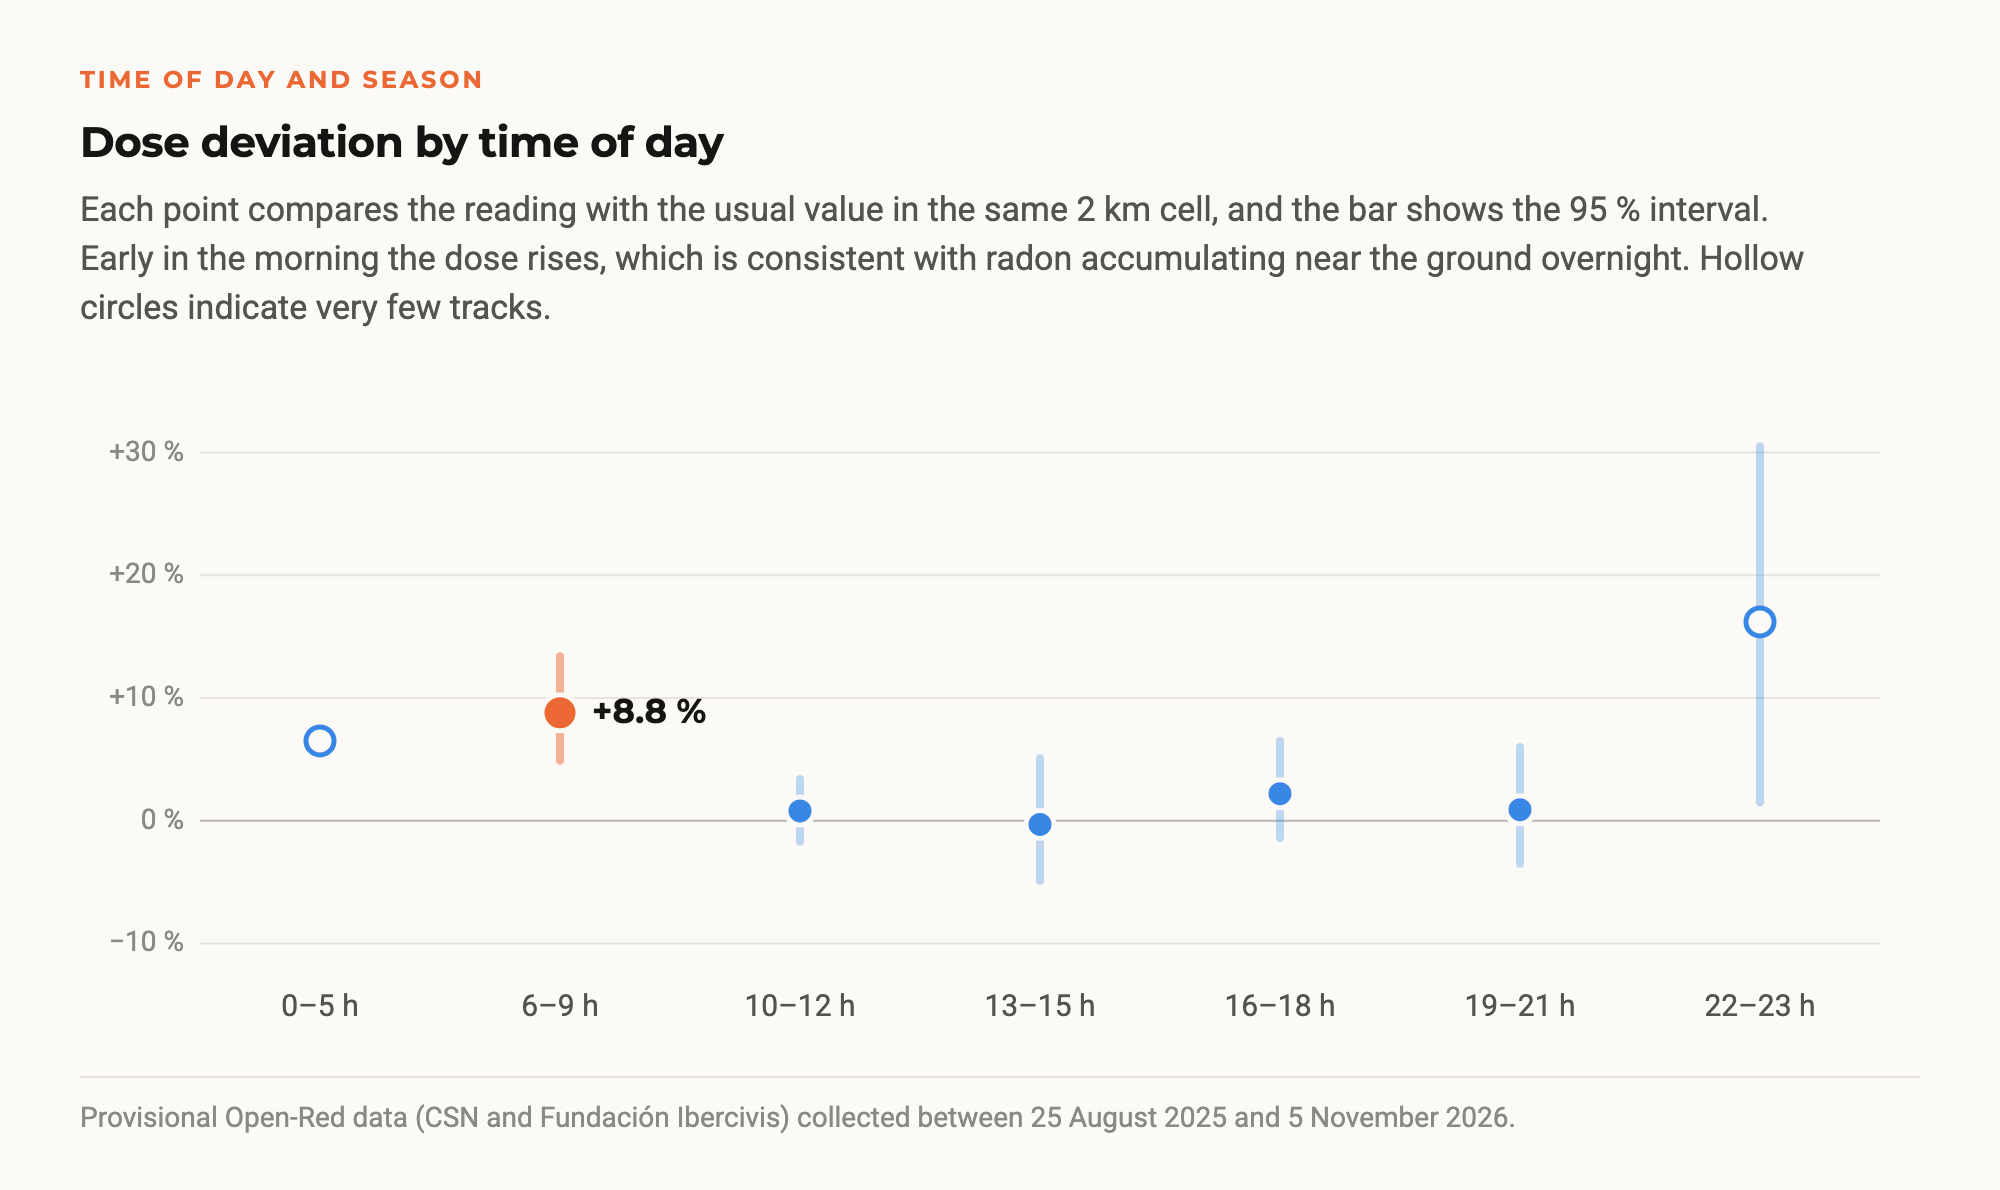
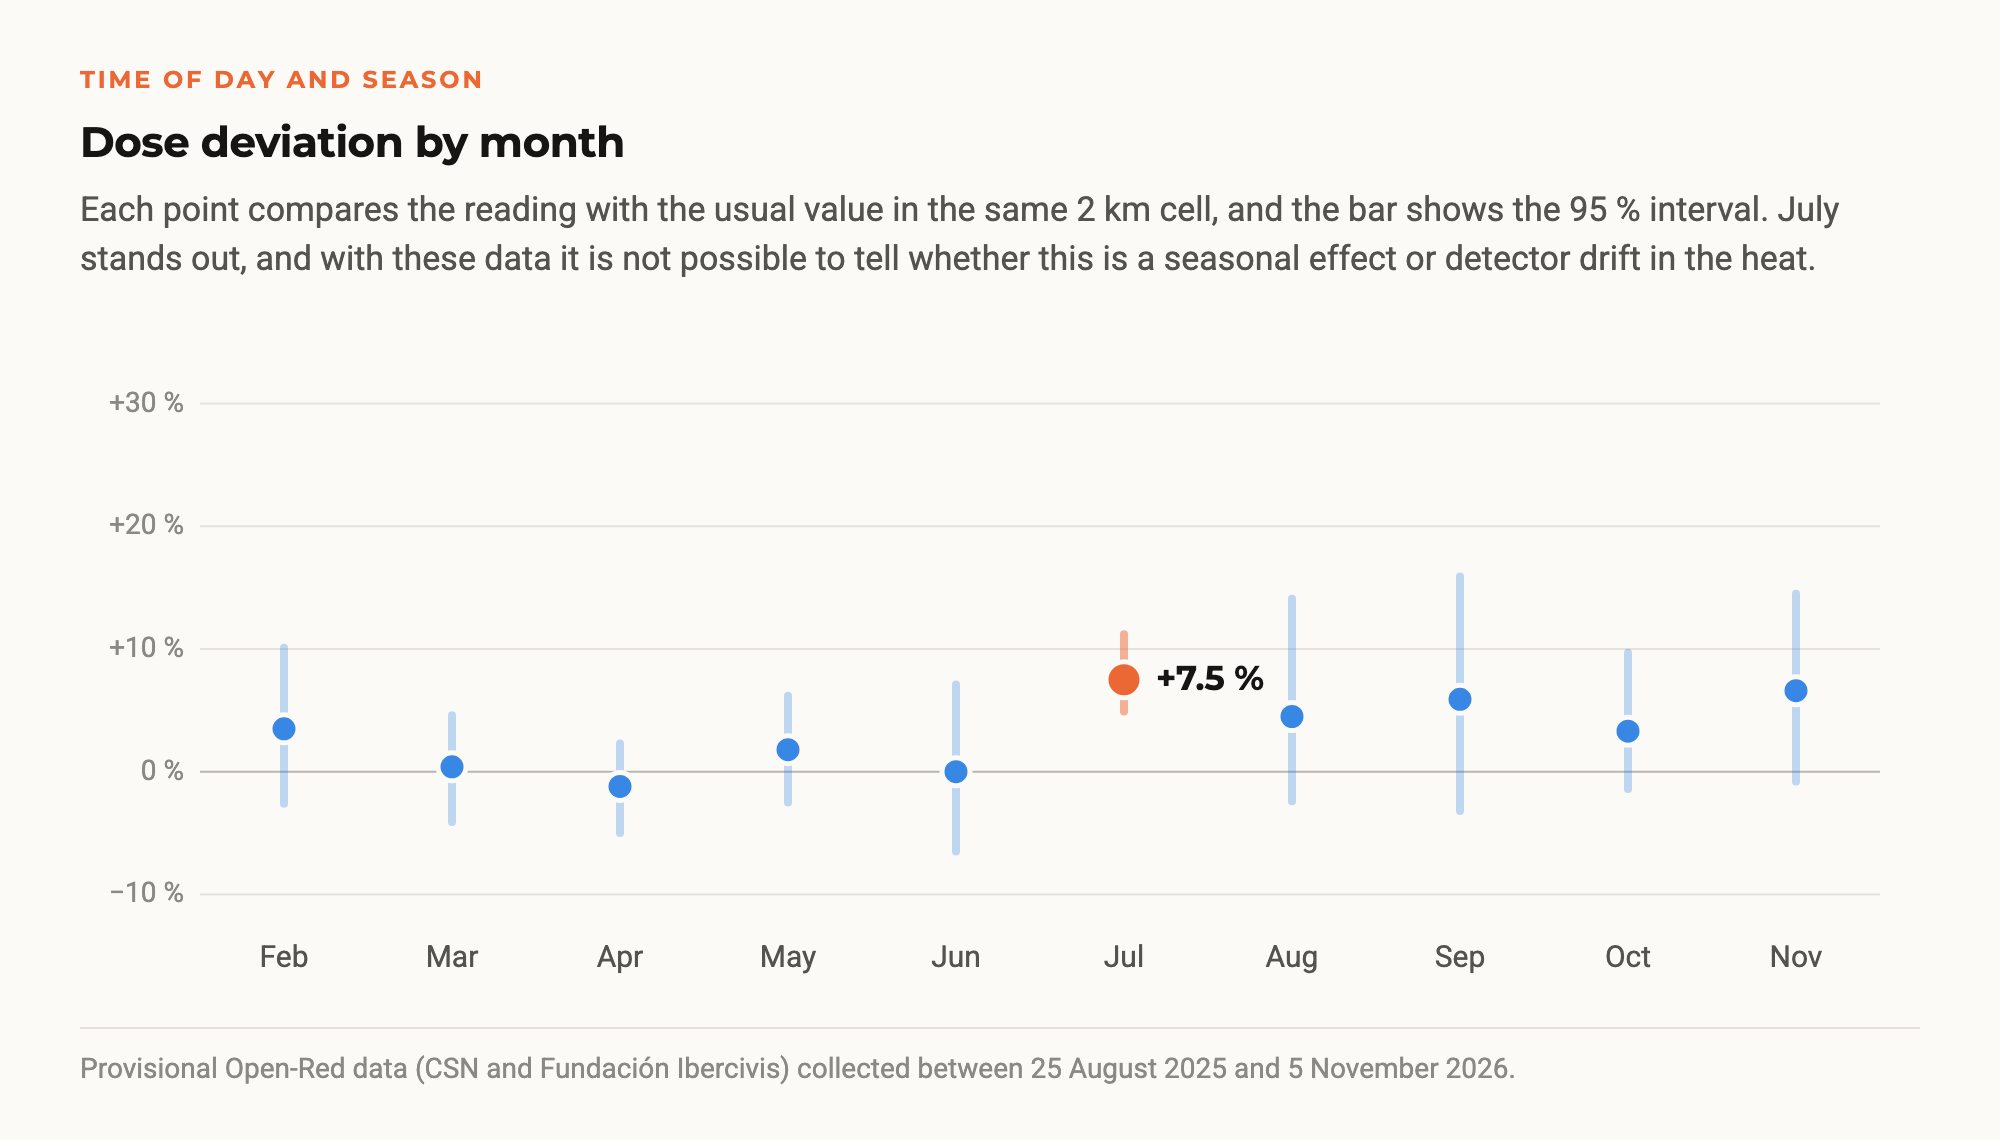
To find out, each measurement was compared with the usual median of its two-kilometre cell and matched with modelled weather data. Rain shows no detectable effect (−2.7 %, with an interval that includes zero), although the analysis warns that the well-known “washout” of radon by rain lasts minutes or hours and only daily rain data were available. Pressure, humidity, wind and temperature show no clear relationship either.
There are, however, two interesting hints. Early in the morning, between 6 and 9 a.m., readings are 8.8 % higher, which is consistent with the well-known overnight build-up of radon near the ground. In July they are 7.5 % higher, which could be a seasonal effect or detector drift in the heat, and the current data cannot tell them apart.
Limitations and next steps
The report is a first exploration, not a peer-reviewed study, and lists its own limitations. Sampling is opportunistic, because where, when and who measures is not chosen at random. Only about ten of the 33 provinces have enough data to be compared. The measurements mix pavements, streets, indoor spaces and vehicles, and only travel speed is controlled. The detectors have not been cross-calibrated against each other. And absolute values have not yet been checked against an official network, so only relative comparisons can be defended and the analysis avoids giving an “average for Spain”.
The next steps are to compare the most measured areas with nearby CSN automatic monitoring stations, talk to the people who measured at Villar de la Yegua, add hourly rainfall data, identify the means of transport of each track, filter inconsistent readings at source and, above all, extend coverage beyond the places where a lot is already measured.

Half a million readings do not yet make an official radiological map. But they show that a network of citizen scientists with well-chosen instruments, traceable data and simple quality control can reproduce what geology predicts, find singular spots and confirm them with more than one device. The map remains open at map.open-red.es, and anyone can explore it or join the network with the app.
How to take part
The questions this analysis leaves open can only be answered with more data. To find out whether the early-morning rise is due to radon, whether the July increase is seasonal or whether rain changes the readings, we need measurements repeated at the same places at different times of day and in different seasons. Anyone who regularly walks the same route with a detector provides exactly this kind of data.
We also need measurements where there are none yet. The network has data in 33 provinces, but only about ten have enough to be compared. In Galicia each province has measurements from a single account, and there is hardly any data from much of Andalusia, Castilla-La Mancha and Extremadura.
There are three ways to join. Anyone with a RadiaCode detector can measure with the Open-Red app for iOS or Android. Anyone who wants to follow the network, ask questions or suggest routes can join the Telegram channel @OpenRedProject. And people or institutions able to organise a campaign with several participants, at a school, an association or a municipality, can borrow detectors, for example five, for two to four weeks. Just write to info@ibercivis.es.
Thank you
These half a million measurements are the work of Open-Red’s citizen scientists. Thank you to everyone who has walked streets, paths and beaches with a detector in hand, to the students and teachers of the schools, to the universities and organisations that hosted the campaigns, to those who took part in the hackathons and to those who keep measuring every week on their own. Without their work this map would not exist. And thank you in advance to everyone who joins from now on.
About the data. The data come from the Open-Red production database and were extracted on 8 November 2026, covering measurements from 25 August 2025 to 5 November 2026. They are provisional results from an exploratory, non-peer-reviewed report, in which each result is labelled as robust, suggestive or inconclusive. Dose values have not been calibrated against an official network, so comparisons are relative. Provinces come from Natural Earth and weather data from Open-Meteo. Open-Red is a project of Fundación Ibercivis with the University of Zaragoza, the University of Cantabria, the Universitat Politècnica de Catalunya and CIEMAT, carried out under an agreement with the Spanish Nuclear Safety Council.